Why Gold and Silver Are Falling Despite Geopolitical Conflict

Safe-haven assets like gold and silver traditionally rally during wartime, but recent market dynamics show a sharp divergence. We examine the macroeconomic forces currently outweighing geopolitical fears.
Pricing the Risk: Weekly Crude Oil Dynamics and Geopolitical Outlook

A critical analysis of this week’s crude oil price action, examining how shifting geopolitical risk premiums and global supply constraints are shaping the outlook for the energy sector.
Decoding AGNC’s Sharp Selloff: Yield Trap or mREIT Buying Opportunity?

AGNC Investment Corp shares took a severe hit this week. We analyze the underlying macro forces driving the selloff, book value pressures, and what it means for dividend investors.
Markets Retreat on Geopolitical Strain: Oil, Gold, and the Late-Week Selloff

A deep dive into the late-week market reversal, driven by escalating geopolitical tensions that sparked a flight to safety in gold and a sharp rally in energy commodities.
Hercules Capital: A High-Yield Gateway to Venture Debt in Today’s Market

Hercules Capital (NYSE: HTGC) is a leading specialist in venture debt—secured loans provided to venture-backed technology and life sciences companies, typically supported by reputable VC sponsors. For value and income investors, HTGC is unusually relevant right now for three reasons: First, the sharp rise in interest rates over the last couple of years has boosted earnings for many BDC (Business Development Company) lenders. A large portion of BDC portfolios are floating-rate, so higher benchmark rates have translated into higher interest income and, in many cases, higher dividends. Second, after the 2021 venture funding boom, the venture capital market cooled materially. Equity checks became harder to secure and often more dilutive. Startups still need capital—but when equity is scarce or expensive, non-dilutive debt becomes more attractive, especially for companies with strong VC backing and clear runway plans. Third, the broader market backdrop matters: investors increasingly debate whether the Fed will begin easing over the next 1–2 years. That creates a key tension for BDCs—today’s yields look great, but future earnings could compress if rates fall. In that environment, underwriting quality and portfolio discipline become the differentiators. Within this context, HTGC stands out as a BDC that has (so far) maintained solid credit performance, kept non-accruals relatively low, and delivered a robust dividend profile in the ~9–10% range—while operating in a niche where demand can actually increase when venture equity gets tighter. Core Analysis 1) Quantitative Snapshot: Valuation, Yield, Profitability, Leverage Valuation (P/E):HTGC trades around ~9–10x earnings, which is below the broader market and competitive relative to large peers like Ares Capital (ARCC). For an income-oriented stock, that’s a meaningful signal: investors aren’t paying growth-stock multiples for current cashflow. Dividend yield:The dividend yield has typically hovered around ~9–10%, supported by a base quarterly payout plus periodic supplemental dividends. This puts HTGC in the “high income” bucket—far above the S&P 500 and often competitive with high-yield credit, but with equity liquidity. Price-to-book (P/B) / premium to NAV:HTGC often trades at a premium to NAV (around ~1.4–1.5x book), suggesting the market assigns higher confidence to its model, underwriting, and internally managed structure. Compared to BDCs that trade close to NAV, a premium can be justified—but it also means part of the “quality story” is already priced in. Return on equity (ROE):HTGC has delivered high ROE (~17% range)—well above many BDC peers. This points to strong portfolio yields, decent expense discipline, and effective capital structure management. Leverage:BDC leverage is regulated, and HTGC’s net leverage has been relatively conservative versus the sector’s limits. That matters because leverage is the hidden engine in BDC returns—great in good times, painful when credit turns. A more conservative balance sheet can protect NAV and dividends through stress. Portfolio yields / earnings power:The engine here is straightforward: HTGC’s loan book has generated double-digit portfolio yields, which—net of funding costs—supports strong net investment income (NII) and dividend capacity. 2) Business Model: Venture Debt With Asymmetric Upside HTGC’s model is not “just lending.” It’s lending plus optionality. Typical HTGC deals are senior secured loans to venture-backed companies, often with: This structure creates a compelling asymmetry: In a risk-off world—where IPO markets are sluggish and exits slow—warrant upside can be muted. But the base lending returns remain the “core,” and HTGC has historically managed this cycle better than many would expect for a venture-linked lender. 3) Dividend Policy: Designed for Stability (With a “Buffer”) HTGC pays a base dividend and has frequently paid supplemental dividends when earnings and realized gains allow. One of the more important (and often overlooked) features in BDC dividend safety is spillover income—undistributed taxable income that can be retained as a cushion. When rates fall or credit costs rise temporarily, spillover can help defend the base payout without immediate cuts. That approach signals a management team that prioritizes sustainability over headline yield—a key difference between “real income” and “yield traps.” 4) Peer Comparison: Where HTGC Sits vs. ARCC and MAIN This positioning is part of the appeal: HTGC gives income investors exposure to venture growth financing without buying volatile high-multiple tech equities directly. Valuation and Forward Scenarios What is HTGC “worth”? BDC valuation is often triangulated using: Given HTGC’s typical premium to NAV, the stock does not look like a “deep discount” value play. But it can still be attractive if you believe: In that framing, HTGC is best viewed as a cashflow-first investment: the majority of expected return comes from dividends, with capital appreciation as a secondary lever. Risks (Bear Case) If you’re buying HTGC, you’re underwriting two macro variables: Other risks include competitive pressure in venture lending, concentration events (a few large problem credits), and regulatory changes affecting BDC structures. Scenario Framework 1) Negative scenario A recession hits tech and VC hard. Defaults rise meaningfully. Rates fall, compressing yields. HTGC may defend the base dividend for a time using spillover, but supplemental payouts disappear and the base becomes vulnerable if stress persists. The stock could trade closer to NAV in a risk-off shock. 2) Base case Growth slows but avoids a deep recession. VC remains selective, which sustains demand for venture debt. Rates ease modestly, trimming NII somewhat—but HTGC offsets part of the impact through portfolio growth and disciplined underwriting. Dividend remains broadly stable, with fewer or smaller supplements. Total return is mostly dividend-driven. 3) Positive scenario Soft landing + controlled rate cuts. Venture activity improves, exits pick up, and warrant gains return. Credit remains contained. HTGC sustains high earnings power, potentially maintains or increases distributions, and the market is willing to pay a higher premium again. Conclusion: The Cartwright Capital View Hercules Capital is a rare case where high yield and perceived quality can coexist—if you accept the macro sensitivity that comes with floating-rate lending and venture exposure. The investment thesis is simple: This is not a “get rich quick” growth story. It’s an income-first position with optionality. If you want venture exposure without owning volatile SaaS multiples—and you’re comfortable with rate and credit-cycle risk—HTGC can earn a seat in a dividend-focused portfolio. This article is
Investors Are Not Ready for What 2026 May Bring

AI disruption, a weakening labor market, and the silent battle over corporate margins Introduction: Why 2026 Matters More Than It Seems Financial markets rarely collapse without warning. More often, they reprice reality gradually, long before the macro headlines turn alarming. What many investors currently describe as “temporary volatility” or “sector rotation” may in fact be the early stages of a deeper structural shift. As we move closer to 2026, multiple stress factors are converging at the same time. Not in consumer demand, not in inflation alone, but in the most fragile part of the corporate system: profit margins. This is not a story about panic.It is a story about mispricing risk. 1️⃣ Two Structural Pressures Hitting Markets Simultaneously 🔹 The Technological Shock: AI Is No Longer a Theme — It’s a Competitor Artificial intelligence has moved far beyond being a speculative growth narrative for tech stocks. It is now directly competing with human labor, including in areas once considered immune: The result is not just higher productivity.It is downward pressure on pricing power. Business models that relied on expensive human expertise are being challenged. In many sectors, AI does not need to be perfect — it only needs to be good enough and dramatically cheaper. That has profound implications for margins. 🔹 The Economic Shift: A Turning Point in the U.S. Labor Market Historically, equity markets tend to ignore labor market weakness — until they can’t. Recent data suggests a clear change in corporate behavior: When companies stop hiring, earnings growth usually follows with a delay.Markets tend to react late, not early. 2️⃣ Why Corporations Are Cutting Jobs — The Real Reasons Publicly, layoffs are framed as efficiency measures. Privately, the drivers are more structural: Major corporations are committing hundreds of billions of dollars to data centers, chips, and AI infrastructure. That capital must come from somewhere — and labor costs are the easiest lever to pull. This is not a short-term adjustment.It is a reallocation of capital priorities. 3️⃣ What Market Behavior Is Telling Us (Beyond Individual Stocks) Rather than focusing on specific companies, it is more useful to observe how capital is behaving: This pattern is consistent with previous late-cycle environments — not crashes, but transitions. 4️⃣ The Investment Mindset Required for 2026 ✔ Patience Only Works If the Business Model Survives Waiting for a recovery makes sense only if the underlying business remains relevant. Low valuation alone is not protection if: Many industries once looked “cheap” for good reason. ✔ Resilience Matters More Than Valuation Multiples In an AI-driven, slowing economy, the most important traits are: Cheap but fragile companies tend to stay cheap — or fail. ✔ A Portfolio Is a System, Not a Collection Every position should have a role: Owning dozens of positions without a clear purpose is not diversification.It is unmanaged risk. 5️⃣ Outlook for 2026: Collapse or Repricing? An immediate, systemic collapse remains unlikely. A more realistic scenario includes: U.S. corporations are still profitable.The question is not if earnings fall — but which businesses can adapt. Conclusion – The Cartwright Capital View 2026 is unlikely to reward impatience. This cycle favors investors who understand: Artificial intelligence is not just a growth catalyst.It is a stress test for business models. And stress tests reveal weaknesses long before markets fully price them in. Disclaimer This article reflects the author’s opinions and interpretations of publicly available information. It is not investment advice. Investing in commodities and financial markets involves risk, and readers should conduct their own research or consult a licensed financial advisor before making any investment decisions. Sources
Is the AI Bubble About to Burst — or Are We Still Early in the Cycle?

Artificial intelligence has become the defining investment theme of this market cycle. Over the past two years, AI-related stocks have delivered outsized returns, valuations have expanded rapidly, and capital has concentrated into a very narrow segment of the equity market. As a result, investors are increasingly asking a critical question: are we witnessing the formation of an AI bubble — and if so, what happens next? This article takes a measured, analytical view, in line with the Cartwright Capital philosophy. Rather than chasing headlines, we focus on fundamentals, capital flows, valuation discipline, and historical context. AI is not evaluated as a slogan, but as an economic force — one that can create long-term value while simultaneously producing short-term excess. Why the AI Bubble Debate Matters Right Now AI is no longer speculative technology. It is actively reshaping cloud computing, enterprise software, advertising, logistics, healthcare, and defense. At the same time, hundreds of billions of dollars are being deployed into AI infrastructure, chips, data centers, and model development. Yet markets are displaying classic late-cycle characteristics: These signals do not imply an imminent crash — but they raise the probability of mispricing. AI Is Real — But Not Every Valuation Is A crucial distinction must be made early: AI itself is not a bubble. Unlike the dot-com era, today’s AI leaders generate: The risk lies elsewhere — in expectations embedded in prices. Many stocks are being valued not on current cash flows, but on optimistic assumptions about growth five to ten years into the future, with little margin for error. From a fundamental perspective, the danger zone appears when: History suggests such assumptions rarely hold indefinitely. Valuations and Market Psychology In parts of the AI ecosystem, we see: Markets are implicitly pricing in a scenario where AI investment demand remains strong regardless of economic conditions. That may prove optimistic. Capital-intensive technologies tend to experience periods of overinvestment followed by normalization — and AI will not be immune. Bull vs. Bear Case for AI The Bull Case The Bear Case The most likely outcome lies between these extremes. The Magnificent Seven: Market Engine and Systemic Risk A central reason the AI bubble debate exists at all is the extraordinary dominance of the Magnificent Seven: Apple, Microsoft, Alphabet, Amazon, Nvidia, Meta, and Tesla. These companies no longer merely represent the technology sector — they effectively define the equity market’s direction. Over the past cycle, a disproportionate share of S&P 500 and Nasdaq gains has been driven by this small group. Concentration alone is not inherently dangerous. What matters is how capital behaves inside this concentration. How Capital Circulates Within the Magnificent Seven Rather than traditional sector rotation, today’s market increasingly exhibits internal rotation within Big Tech itself. A common pattern: The result is a market that appears healthy at the index level while participation narrows underneath. The AI Capital Feedback Loop One of the most distinctive features of this cycle is that the Magnificent Seven reinforce each other’s growth: This creates a positive feedback loop — powerful, but inherently fragile. If: the loop can reverse faster than expected. Not Dot-Com — But Late-Cycle Behavior It is critical to avoid false analogies. The Magnificent Seven are not speculative startups. They generate enormous cash flow and control essential digital infrastructure. However, the resemblance to past bubbles lies in expectation concentration, not business quality. Markets currently assume: Historically, technology cycles rarely conclude with permanent dominance by a fixed group. What Happens If One Link Breaks? The Magnificent Seven are now sentiment-linked. A meaningful disappointment from: would likely trigger basket-level selling. Passive flows, ETFs, and systematic strategies treat these stocks as a single exposure. The result would not reflect collapsing fundamentals — but rather risk repricing. Three Plausible Scenarios Ahead Conservative Scenario AI remains a structural trend, but capital rotates away from weaker names. Valuations compress while leaders survive. Base Case Markets experience a healthy correction, separating durable cash-flow generators from speculative narratives. Negative Scenario A macro shock accelerates risk-off behavior, with AI acting as the catalyst rather than the cause. The Cartwright Capital View From an investment standpoint, Cartwright Capital sees no evidence that AI itself is a bubble. What exists instead is selective excess, driven by capital concentration and unrealistic expectations. AI will likely reshape productivity and profitability over the next decade. But returns will not be evenly distributed — nor will they follow a straight line. The real risk is not technological failure.It is overconfidence in valuation permanence. Disciplined investors should focus on: If an AI bubble exists, it is not in the technology, but in the belief that today’s capital concentration can persist indefinitely. Disclaimer This article reflects the author’s opinions and interpretations of publicly available information. It is not investment advice. Investing in commodities and financial markets involves risk, and readers should conduct their own research or consult a licensed financial advisor before making any investment decisions. Sources
Weekly Market Recap: What Moved Global Markets (February 2–6, 2026)
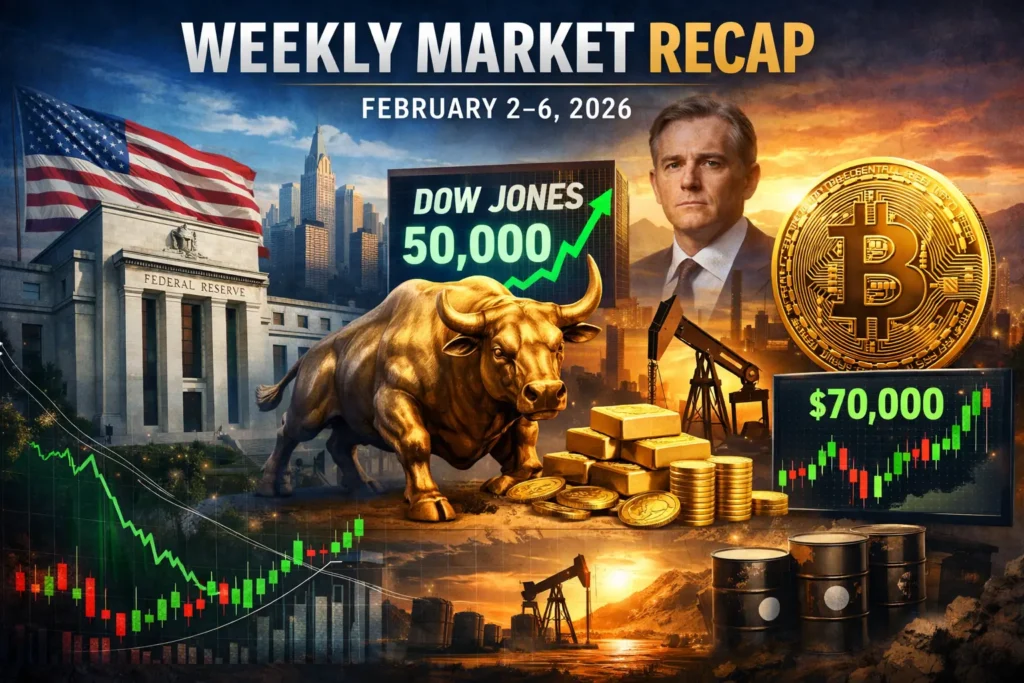
The past week delivered heightened volatility across global financial markets, driven by a mix of monetary policy uncertainty, sharp moves in risk sentiment, and notable fluctuations across equities, commodities, and cryptocurrencies. Investors navigated shifting expectations around the Federal Reserve, strong U.S. dollar dynamics, and rapid price adjustments in both traditional and digital assets. This weekly recap summarizes the key macroeconomic developments, market reactions, and asset-class performance from February 2 to February 6, 2026. Global Macro & Market Environment Market sentiment throughout the week oscillated between risk-off and selective dip-buying. Early in the week, investors reacted cautiously to renewed speculation around U.S. monetary policy leadership and the future trajectory of interest rates. These concerns temporarily strengthened the U.S. dollar and pressured commodities and risk assets. As the week progressed, markets began stabilizing, with Friday delivering a sharp rebound across several asset classes. The result was a week defined less by a single trend and more by rapid sentiment shifts and elevated volatility. Equity Markets: Volatility Followed by Recovery United States U.S. equities experienced significant turbulence mid-week, with broad sell-offs driven by risk aversion and profit-taking, particularly in technology stocks. However, Friday’s session marked a strong turnaround: Despite the late-week rally, investor positioning remains cautious, with markets highly sensitive to upcoming macro data and Fed-related signals. Europe & Canada European equities showed mixed performance, with some indices holding near record levels despite broader market uncertainty. In Canada, the TSX Composite Index recorded its strongest daily gain in several months, supported primarily by a rebound in metal prices and improved sentiment toward resource stocks. Commodities: Gold and Oil in Focus Gold and Precious Metals Precious metals faced significant downward pressure during the first half of the week. Gold prices declined sharply as the U.S. dollar strengthened and markets reassessed the outlook for U.S. monetary policy. Key drivers included: Toward the end of the week, gold staged a modest technical rebound, suggesting that some investors began re-entering positions after the sharp correction. Weekly takeaway: gold experienced a pronounced sell-off, followed by stabilization and early signs of recovery. Oil Oil prices traded in a volatile but largely range-bound fashion: Overall, crude oil ended the week without a clear directional trend but remained highly sensitive to geopolitical and macroeconomic headlines. Cryptocurrencies: High Volatility and Sharp Rebound Cryptocurrency markets once again behaved as high-beta risk assets, closely tracking broader risk sentiment: Ethereum and other major cryptocurrencies followed a similar pattern, underscoring the sector’s continued sensitivity to macro conditions and investor risk appetite. Federal Reserve & Monetary Policy Uncertainty A key macro theme this week was uncertainty surrounding the future leadership of the Federal Reserve, particularly speculation around a potential nomination of Kevin Warsh as Fed Chair. Markets interpreted this development as potentially more hawkish, contributing to: While no immediate policy changes are expected, sentiment remains fragile and highly reactive to any signals regarding future rate decisions. Key Macroeconomic Data Several data points contributed to short-term market movements: Key Takeaways from the Week Disclaimer This article reflects the author’s opinions and interpretations of publicly available information. It is not investment advice. Investing in commodities and financial markets involves risk, and readers should conduct their own research or consult a licensed financial advisor before making any investment decisions. Sources
Why Are Cryptocurrencies Falling?
Macro reality, liquidity, and the end of illusions Cryptocurrency markets are once again experiencing sharp sell-offs. For many investors, this may feel chaotic, emotional, and unexpected. In reality, however, nothing about this move is random. The decline in crypto assets is the result of a combination of macroeconomic pressure, shifting capital behavior, and structural weaknesses within the crypto sector itself. At Cartwright Capital, we look at markets without emotion—through data, liquidity, and long-term cycles. Let’s break down the key reasons why cryptocurrencies are falling and what this means for investors. 1. Cryptocurrencies Are Extremely Sensitive to Liquidity A fundamental fact that is often overlooked: crypto does not exist in a vacuum. It is a pure risk-on asset. Over recent years, crypto benefited from: That environment is now gone. Central banks today: 👉 Without cheap money, crypto loses its primary fuel. 2. High Interest Rates Change Capital Allocation When safe assets (cash, bonds) yielded close to zero, investors were forced to take risk.Today, the situation is reversed. Crypto: In a high-rate environment, this is a major disadvantage. 3. Exit of Speculative and Leveraged Capital A significant portion of the previous crypto rally was driven not by long-term investors, but by: When the market turns: This explains why crypto sell-offs are often: 👉 It’s not just selling—it’s a cascade of forced liquidations. 4. The Weakening “Digital Gold” Narrative Bitcoin has often been marketed as: The reality of recent years: This undermines confidence among investors who expected a stabilizing asset. When the narrative breaks, the market is left without a story—and without a story, capital does not flow in. 5. Regulation, Uncertainty, and Structural Risks Additional pressure comes from the institutional side: Institutions: Without institutional capital, the crypto market struggles to sustain long-term growth. 6. Market Psychology: The Disillusionment Phase Every speculative market follows a familiar cycle: Crypto is currently somewhere between stages 3 and 4. And it is precisely in this phase that prices often fall further than fundamentals alone would justify. What Does This Mean for Investors? From a Cartwright Capital perspective, the key is to separate emotion from reality: Key questions every investor should ask today: Crypto can have a place in a portfolio—but only as a high-risk allocation, not as a substitute for fundamentally backed investments. Final Thoughts The current decline in cryptocurrencies is neither accidental nor the failure of a single project.It is a logical consequence of tighter financial conditions, liquidity withdrawal, and shifting capital preferences. Markets are being cleansed. Illusions are fading. And it is precisely during such periods that speculation is separated from real investing. At Cartwright Capital, one principle remains constant:first survive—then grow. Sources
Why Did PayPal Stock Collapse Today?
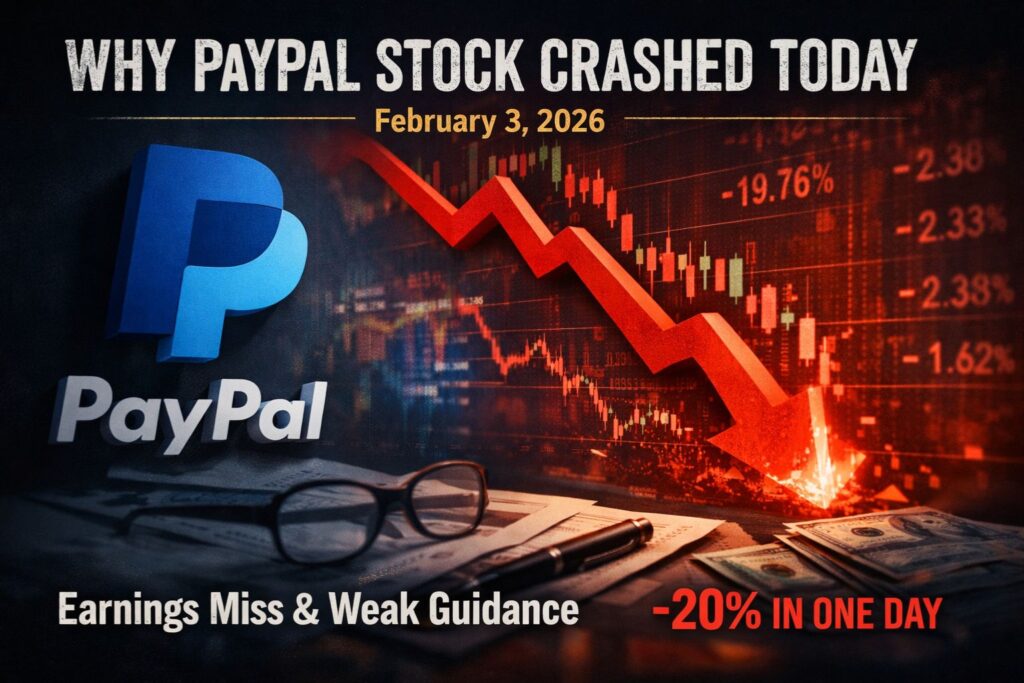
Date: February 3, 2026Ticker: PayPal (PYPL)Closing price (intraday): ~42 USDDaily move: ~-20% A market wake-up call, not a random sell-off PayPal shares suffered one of their sharpest single-day declines in years, plunging close to 20% after the company reported earnings. While the headline numbers were weaker than expected, the true reason behind the sell-off runs deeper. This was not merely a “bad quarter” reaction — it was a full valuation reset. In short, the market stopped treating PayPal as a growth-oriented fintech and began pricing it as a mature, slow-growth payments company. 1. Earnings missed — but that alone wasn’t the problem Yes, PayPal underdelivered: Under normal circumstances, such a miss might have caused a 5–8% pullback. Instead, the stock collapsed nearly 20%. That tells us one thing clearly: the miss was only the trigger, not the core issue. 2. Guidance shock: the real catalyst The decisive blow came from management’s forward guidance. PayPal signaled: Markets are forward-looking, and what investors heard was simple:“The next phase will not look materially better than the last.” For a stock still carrying remnants of a growth multiple, that was unacceptable. 3. The “growth illusion” finally broke For years, PayPal benefited from its legacy status as a fintech pioneer. Even as growth slowed, the market was willing to believe that: This earnings release effectively killed that narrative. Once investors accepted that PayPal’s business resembles a stable — but unexciting — payments processor, the valuation had to adjust accordingly. That adjustment happened in one brutal session. 4. Competitive pressure is no longer theoretical PayPal now operates in a landscape dominated by: The company’s core product — branded checkout — is no longer a clear moat. Growth is increasingly driven by promotions rather than organic demand, putting sustained pressure on margins. The market no longer views this as temporary. 5. Technical damage accelerated the sell-off From a technical perspective, the stock broke: Once those levels failed, algorithmic and institutional selling accelerated the decline. Volume spiked, confirming that this was not retail panic but professional de-risking. In such moments, price moves faster than fundamentals — and it did. 6. A brutal but honest re-rating At around 42 USD, PayPal now trades closer to: This does not mean PayPal is broken as a business. It remains profitable, cash-generative, and operationally solid. But it does mean that the market has removed the benefit of the doubt. What investors should take away This was not a one-day overreaction. It was the market acknowledging reality. PayPal fell because: Whether the stock stabilizes or continues lower will depend not on promises, but on execution, margin discipline, and proof of relevance in a crowded payments ecosystem. Final thought from Cartwright Capital “Markets are unforgiving when a company transitions from growth to maturity. PayPal didn’t just miss expectations — it lost its story.” For long-term investors, this reset may eventually create opportunity. But in the short term, the message is clear: the market is no longer willing to wait. Disclaimer This article reflects the author’s opinions and interpretations of publicly available information. It is not investment advice. Investing in commodities and financial markets involves risk, and readers should conduct their own research or consult a licensed financial advisor before making any investment decisions.
1985 Revisited: Is the US Dollar Approaching Another Turning Point?
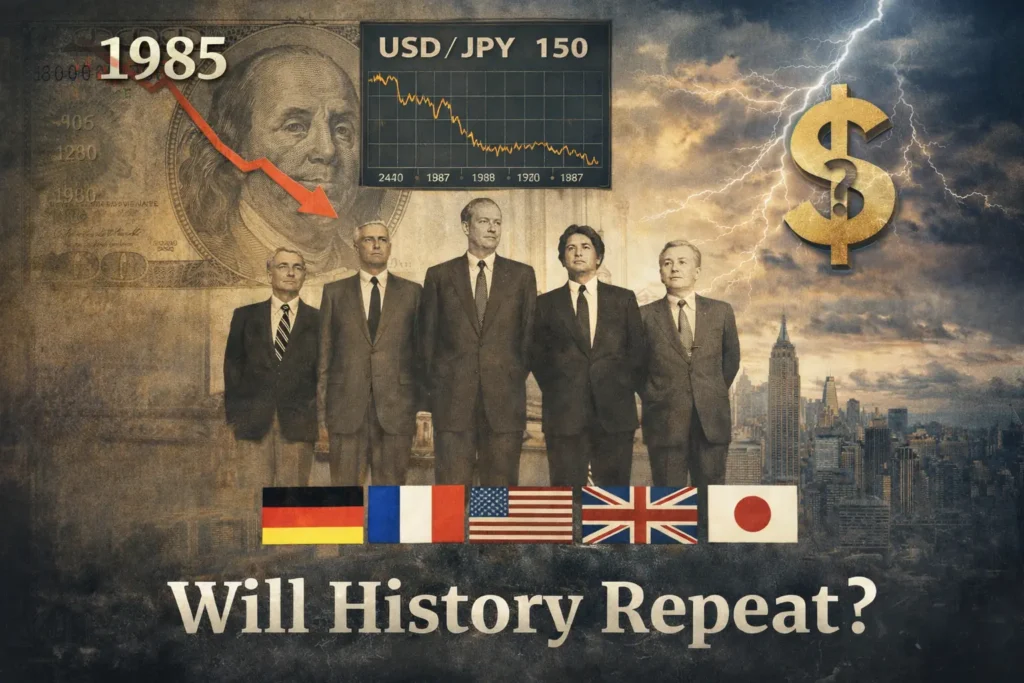
Introduction: when history starts to rhyme Financial markets rarely repeat themselves precisely, but they often rhyme. One of the most frequently cited historical parallels in today’s macroeconomic debate is the mid-1980s — a period marked by an exceptionally strong US dollar, rising global imbalances, and ultimately a coordinated policy response that reshaped currency markets for years. The year 1985 stands as a reference point not because of a crisis, but because of a deliberate intervention that acknowledged structural imbalance. As the global economy once again navigates a phase of dollar dominance, the comparison is becoming increasingly relevant. The setup: why the dollar became too strong in the early 1980s In the early 1980s, the US dollar surged dramatically. The drivers were clear: Between 1980 and 1985, the dollar appreciated by more than 50% against major currencies such as the Japanese yen and the German mark. While this helped tame inflation, it created severe trade distortions. US exports became uncompetitive, manufacturing pressure intensified, and trade deficits ballooned. The strong dollar had fulfilled its monetary role — but overstayed its economic welcome. The Plaza Accord: a controlled reset, not a panic In September 1985, finance ministers and central bank governors from the United States, Japan, West Germany, France, and the United Kingdom met in New York. The outcome became known as the Plaza Accord. The agreement’s objective was explicit: The result was historic. Over the following two years: Crucially, this was not a market-driven collapse, but a policy-managed adjustment. Consequences: second-order effects mattered more than the headline While the dollar’s decline itself was orderly, the secondary consequences were profound — particularly for Japan. A sharply stronger yen pushed Japanese policymakers toward aggressive monetary easing. The outcome was one of the largest asset bubbles in modern history, culminating in the equity and real estate collapse of the early 1990s and Japan’s subsequent “lost decades.” This remains a critical lesson: Currency realignments rarely end with currencies. Fast forward to today: familiar conditions, different system At first glance, today’s environment shares notable similarities with 1985: Factor Mid-1980s Today USD strength Extreme Elevated Interest rates High Restrictive Trade deficits Rising Structurally large Capital inflows Yield-driven Yield + safety-driven Global tensions Moderate High However, the differences are equally important. Today’s financial system is: Moreover, the US fiscal position is significantly weaker, and the dollar’s role extends far beyond trade — it is embedded in global debt markets. Why a “Plaza Accord 2.0” would look very different Unlike in 1985, a coordinated dollar depreciation today would face major constraints: As a result, any future dollar adjustment is more likely to be: The absence of a Plaza-style announcement does not preclude a multi-year realignment — it simply changes the transmission mechanism. What history suggests — without predicting outcomes The lesson of 1985 is not that the dollar must weaken, but that currency dominance has limits. Historically: For globally diversified portfolios, currency becomes less about timing and more about structural awareness. Conclusion: awareness over anticipation The events of 1985 demonstrate that major currency shifts do not require panic to be impactful. They emerge when economic realities force adjustment, often under the guise of stability. Whether today’s dollar strength leads to a similar inflection point remains uncertain. What is clear is that currency dynamics operate on longer cycles than most investors expect, and their influence extends far beyond exchange rates alone. History may not repeat itself — but it continues to offer a valuable framework for understanding what lies ahead. Disclaimer This article reflects the author’s opinions and interpretations of publicly available information. It is not investment advice. Investing in commodities and financial markets involves risk, and readers should conduct their own research or consult a licensed financial advisor before making any investment decisions. Sources Historical & Policy Background Currency Markets & FX Impact Academic & Financial Analysis Market Commentary & Modern Parallels Equity & Investor Perspective
Grab Holdings (GRAB): From Cash Burn to Cash Generation

Grab Holdings has long been perceived as a high-growth but structurally unprofitable platform company. Over the past two years, however, the narrative has begun to shift. After years of aggressive expansion and heavy cash burn, Grab has reached a critical inflection point — achieving positive cash flow and approaching sustainable profitability. This analysis evaluates Grab through a disciplined fundamental lens, focusing on financial health, competitive advantages, management quality, valuation, and long-term intrinsic value. The goal is not to chase momentum, but to assess whether Grab is evolving into a durable, cash-generating business worthy of long-term capital. 1. Business Overview: What Grab Really Is (and Is Not) Grab is Southeast Asia’s leading “super-app,” operating across mobility, food delivery, logistics, digital payments, and financial services. Unlike single-vertical peers, Grab integrates multiple daily-use services into one ecosystem, creating powerful cross-usage and retention dynamics. Today, Grab operates in 8 countries and more than 800 cities, serving tens of millions of monthly active users and millions of drivers, couriers, and merchants. This scale is central to its long-term investment thesis. However, Grab should not be viewed as a traditional value stock. It is best understood as a platform transitioning from growth-at-all-costs to operational discipline. 2. Financial Health: Balance Sheet Strength vs. Return on Capital From a balance-sheet perspective, Grab is in a strong position: This financial flexibility significantly reduces existential risk and gives management room to invest selectively. That said, returns on capital remain low. Current ROE and ROIC are still well below the estimated cost of capital, reflecting a business that has only recently crossed into profitability. This is not unusual for platform companies at this stage — but it remains a key metric to monitor going forward. The direction of travel matters more than the absolute level. Margins have improved materially, and free cash flow has turned positive. 3. Revenue Growth and Profitability Trajectory Grab’s revenue growth over the past five years has been substantial, though clearly decelerating as the company scales: More importantly, losses have narrowed dramatically: Free cash flow turning positive represents a structural shift. The core investment question now becomes whether Grab can expand margins without sacrificing growth. 4. Competitive Advantage: Does Grab Have a Moat? Grab exhibits several characteristics of a defensible economic moat: Network effects More users attract more drivers and merchants, improving service quality and reinforcing platform dominance. Super-app ecosystem Combining mobility, delivery, payments, and fintech increases switching costs and user stickiness. Brand leadership In many Southeast Asian markets, Grab is synonymous with ride-hailing and on-demand services. Scale economics High transaction volume allows fixed costs to be spread efficiently, improving unit economics relative to smaller competitors. While competition and regulation remain real risks, Grab’s ecosystem scale makes it difficult to dislodge. 5. Management Quality and Ownership Alignment Grab remains founder-led, with a long-term strategic vision that has been consistently executed. Importantly, management has clearly shifted priorities toward profitability and capital discipline. Ownership structure supports alignment: This alignment reduces agency risk and supports a long-term investment horizon. 6. Growth Catalysts: Where Upside Could Come From Several catalysts could unlock incremental value: None of these alone is decisive — but together they form a credible medium-term growth framework. 7. Valuation and Intrinsic Value: Growth vs. Margin of Safety At current prices, Grab does not screen as “cheap” on traditional multiples. The stock is priced as a profitable growth platform, not a distressed turnaround. Intrinsic value estimates vary widely depending on assumptions. Under reasonable base-case scenarios, Grab appears fairly valued to modestly undervalued, but without a wide margin of safety. This makes Grab unsuitable for deep value investors, but potentially attractive for investors comfortable underwriting execution and margin expansion risk. 8. Key Risks to the Thesis These risks warrant conservative position sizing and ongoing monitoring. Investor Takeaway (Cartwright Capital View) Grab is no longer a speculative cash-burning story. It is a financially stable, platform-scale business transitioning into sustainable profitability. The balance sheet is strong, execution has improved, and the ecosystem exhibits genuine moat characteristics. However, the valuation already reflects a meaningful portion of this progress. Grab may offer moderate upside with execution, rather than asymmetric deep-value returns. For long-term investors, Grab fits best as a selective growth allocation, not a core value holding. Disclaimer This article reflects the author’s opinions and interpretations of publicly available information. It is not investment advice. Investing in commodities and financial markets involves risk, and readers should conduct their own research or consult a licensed financial advisor before making any investment decisions. Sources & References Company Filings & Official Materials Financial Data & Market Information Fundamental Analysis & Valuation Framework Screening & Comparative Analysis Tools Industry & Competitive Context
Weekly Market Recap: Geopolitics, Monetary Policy and a Reality Check for Risk Assets
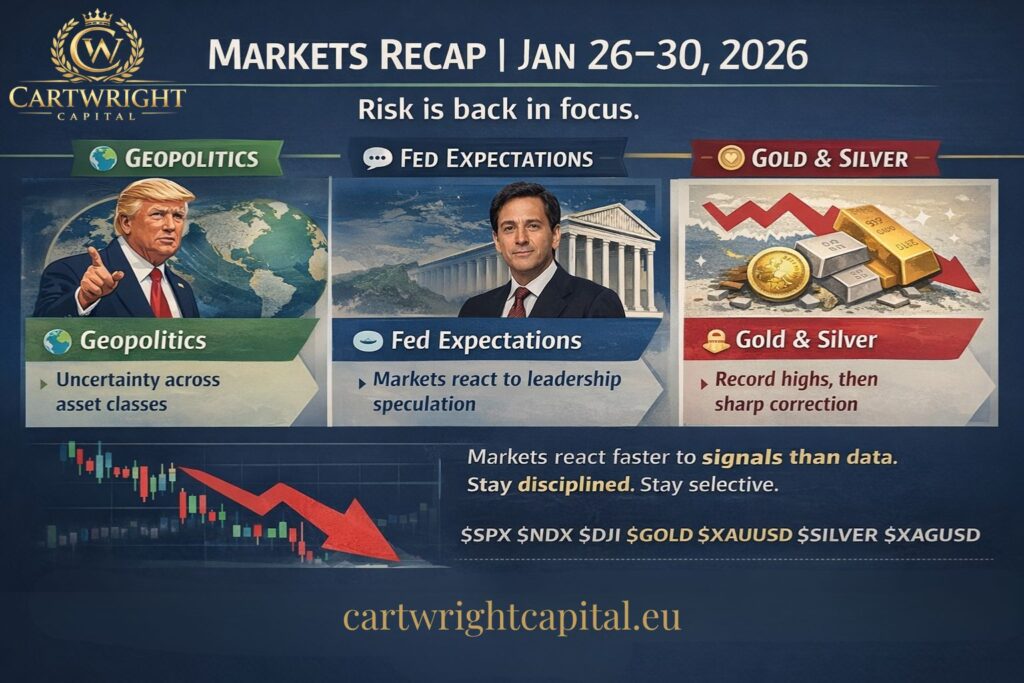
January 26–30, 2026 The final week of January delivered a powerful reminder of how fragile market sentiment remains in 2026. Geopolitical tensions, renewed uncertainty around U.S. monetary policy, and extreme volatility in precious metals combined to unsettle investors across asset classes. From record-breaking rallies to abrupt sell-offs, markets were driven less by hard data and more by expectations, political signaling, and positioning. 🌍 Global Context: Politics Back at the Center of Markets Geopolitics reasserted itself as a dominant market driver. The Trump administration continued to apply a confrontational tone toward international partners, including renewed trade rhetoric and strategic pressure on allies. While no immediate policy shifts were enacted, the uncertainty premium embedded in markets increased noticeably. At the same time, discussions at the World Economic Forum in Davos highlighted a growing disconnect between political ambitions and economic realities. Calls for cooperation, technological investment, and stability contrasted sharply with the rising fragmentation of global trade and diplomacy. For investors, the message was clear: political risk is no longer a tail risk—it is a core input in asset pricing. 🇺🇸 The Federal Reserve Question: Expectations Drive Volatility One of the most influential narratives of the week revolved around speculation regarding the future leadership of the Federal Reserve. Reports suggesting that President Trump favors Kevin Warsh as a potential future Fed Chair triggered a sharp reassessment of interest rate expectations. While no official appointment has been made, markets interpreted the signal as a possible shift toward a more hawkish monetary stance. The immediate consequences were visible: This episode once again demonstrated that markets react not to decisions, but to perceived trajectories. 📈 Equity Markets: Stability on the Surface, Fragility Underneath Equity markets delivered mixed signals throughout the week. Overall, equities did not collapse—but they stopped ignoring risk. 🪙 Gold and Silver: From Euphoria to Liquidation Precious metals experienced one of the most dramatic weeks in recent history. Early Week: Safe-Haven Surge Driven by geopolitical anxiety and falling confidence in policy stability: Late Week: Violent Reversal As expectations around Fed leadership and rate policy shifted: 🧠 What This Week Really Means Investment Insight – Cartwright Capital “This week was not about fundamentals—it was about positioning and confidence. Gold and silver didn’t collapse because the long-term thesis disappeared. They corrected because markets had priced in perfection. On the equity side, investors are beginning to differentiate again. Cash flow, balance sheet strength, and valuation discipline matter more than narratives. The key takeaway: volatility is not a threat—it’s a signal. And in 2026, signals matter more than forecasts.” 🔍 Strategic Takeaways for Investors 🧾 Conclusion The week of January 26–30, 2026, reminded investors of a simple truth:markets are no longer driven by optimism alone. In an environment shaped by geopolitics, monetary uncertainty, and elevated valuations, discipline is replacing momentum. Those who adapt will survive volatility.Those who ignore it will be surprised by it. Disclaimer This article reflects the author’s opinions and interpretations of publicly available information. It is not investment advice. Investing in commodities and financial markets involves risk, and readers should conduct their own research or consult a licensed financial advisor before making any investment decisions. Sources
Why Did Markets Fall This Week? Politics, the Fed, and a Reality Check on Risk
Global equity markets had a weak week, reminding investors that 2026 is unlikely to be a smooth, one-directional rally. The sell-off was not triggered by a single dramatic event. Instead, it was driven by a combination of political uncertainty, monetary policy expectations, and a long-overdue reassessment of risk. Here are the key factors behind the move. 1️⃣ Politics: Trump Back in the Market Narrative One of the main sources of renewed uncertainty is the growing political relevance of Donald Trump. Markets are not reacting to polling numbers alone, but to the implications of a realistic Trump return to power. Investors are increasingly pricing in: Markets dislike uncertainty more than bad news. A wider range of political outcomes automatically means a higher risk premium for equities. 2️⃣ The Federal Reserve: Higher Rates for Longer Another critical factor was communication from the Federal Reserve. While no new Fed leadership has been appointed, the tone of recent messaging has been enough to unsettle markets. The key takeaway: This matters because: 3️⃣ Bond Markets Are Sending a Warning One of the strongest signals did not come from equities, but from bonds. In simple terms:👉 capital is no longer cheap👉 risk assets must adjust Equities are now catching up with what bond markets have been signaling for weeks. 4️⃣ Valuations Were Stretched It is important to keep context in mind. Markets had rallied strongly before this pullback. Once higher rates and political uncertainty re-entered the equation, profit-taking was inevitable. This was not panic selling—it was a rational reset. 5️⃣ Market Psychology: From Optimism to Caution Markets move in cycles: The current phase reflects a shift away from narratives and toward fundamentals: This transition tends to be uncomfortable—but healthy. What This Means for Investors 👉 This does not signal the end of the bull market, but rather a change in regime.👉 In 2026, politics and central banks will matter as much as corporate earnings.👉 Quality, diversification, and cash flow are back in focus. Assets such as gold, defensive equities, dividend payers, and companies with strong balance sheets are regaining relevance. Blindly chasing growth without regard to valuation or rates carries increasing risk. Disclaimer This article reflects the author’s opinions and interpretations of publicly available information. It is not investment advice. Investing in commodities and financial markets involves risk, and readers should conduct their own research or consult a licensed financial advisor before making any investment decisions. Sources & References
Precious Metals Under Pressure:
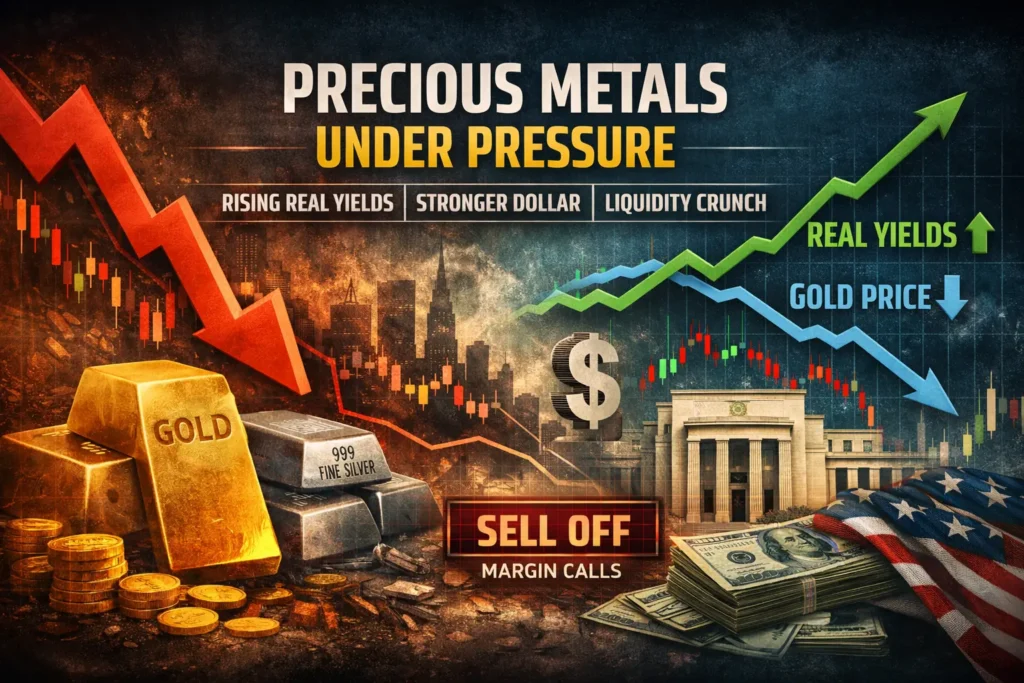
A Macro-Liquidity Reset, Not a Structural Breakdown he recent sell-off across precious metals has been violent, fast, and unsettling. Gold, silver, and related assets have declined sharply, triggering widespread questions about whether the long-term thesis is breaking down. It is not. What we are witnessing is a macro-liquidity reset, driven by real rates, dollar dynamics, and positioning — not a collapse in the structural case for precious metals. 1️⃣ Real yields are reasserting dominance At the core of the move lies a simple but powerful relationship: Gold prices move inversely to real interest rates. Over the past sessions: ➡️ Real yields have moved decisively higher This matters because: This is not a policy shift — it is a repricing of duration and risk-free returns. 2️⃣ The bond market is tightening financial conditions The sell-off in precious metals cannot be understood without the bond market. Key dynamics: This results in: Gold is not being “rejected” — it is being temporarily deprioritized in a world where capital again earns yield. 3️⃣ Dollar liquidity is tightening — quietly This is not about a dramatic dollar surge.It is about dollar scarcity at the margin. Contributing factors include: When dollar liquidity tightens: This is a liquidity hierarchy event, not a confidence crisis. 4️⃣ Positioning: crowded trades unwind brutally Before the sell-off: That combination is dangerous. Once key levels broke: This created a non-linear downside move, entirely mechanical in nature. Importantly:This selling was not based on new information — it was based on risk management rules. 5️⃣ Risk assets absorb liquidity temporarily Despite geopolitical risks and fiscal imbalances: In such phases: This is typical late-cycle behavior — not a signal of systemic stability. 6️⃣ Structural forces remain intact None of the following have changed: Precious metals do not respond linearly to these forces.They respond when confidence breaks, not while it is being temporarily patched. Strategic takeaway This sell-off is best understood as: It is not a repudiation of gold’s role in the global financial system. Historically: The market is currently pricing control.Gold prices instability. Those two states rarely coexist for long. Cartwright Capital perspective Markets are once again prioritizing yield, discipline, and liquidity. That phase tends to: Precious metals are not early-cycle assets.They are systemic insurance. And insurance is always cheapest before it is needed again. Disclaimer This article reflects the author’s opinions and interpretations of publicly available information. It is not investment advice. Investing in commodities and financial markets involves risk, and readers should conduct their own research or consult a licensed financial advisor before making any investment decisions. Sources
Key Earnings Highlights: What Major Corporations Revealed on January 28–29, 2026
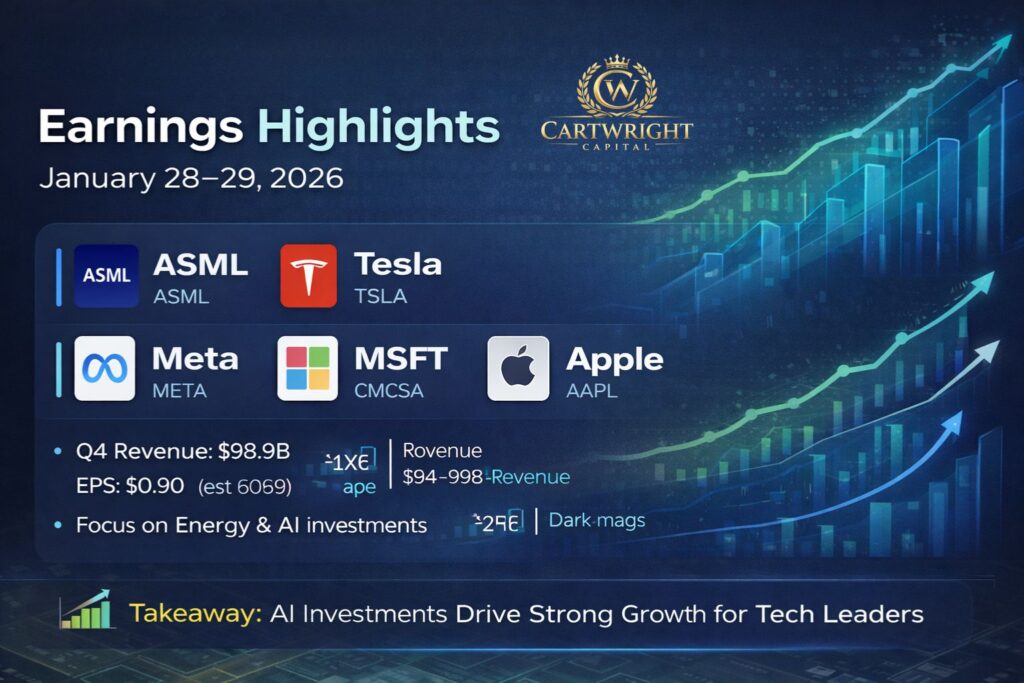
Date: January 28–29, 2026 The final days of January brought one of the most closely watched earnings windows of the quarter. Several global market leaders across technology, semiconductors, automotive, media, and communications reported their latest results, offering valuable insight into corporate profitability, capital allocation, and strategic direction as we enter 2026. Companies such as ASML, Tesla, Meta Platforms, Microsoft, Comcast, and Apple collectively shape investor sentiment—and their earnings this week clearly underline one dominant theme: AI-driven investment and capital intensity are redefining the market landscape. Below is a structured overview of the most important earnings releases from January 28–29, 2026. ASML (ASML) – Semiconductor Backbone of the AI Cycle Reported: January 28, 2026 (Pre-Market) ASML delivered one of the strongest reports of the season, confirming its role as a critical supplier to the global semiconductor ecosystem. ASML also announced an expanded share buyback program totaling €12 billion and increased shareholder returns via dividends. Cartwright Capital view:ASML’s results confirm that AI-driven demand is not a short-term narrative but a structural trend. The company’s backlog and forward guidance provide rare visibility in an otherwise uncertain macro environment. Tesla (TSLA) – Transition Phase Between EVs and AI Reported: January 28, 2026 (After Market Close) Tesla’s results exceeded consensus expectations but highlighted an ongoing transition in its business model. Management emphasized continued investment in autonomous driving, robotics, and AI infrastructure, while traditional EV growth remains under pressure. Cartwright Capital view:Tesla is increasingly valued less as a pure automotive company and more as a long-duration AI and energy platform. Execution risk remains, but strategic optionality is significant. Meta Platforms (META) – AI at Full Scale Reported: January 28–29, 2026 Meta delivered a standout earnings report, beating expectations on both revenue and profitability. The company continues to benefit from strong advertising demand while aggressively scaling AI infrastructure. Cartwright Capital view:Meta’s earnings reinforce a clear message: advertising monetization and AI investment are no longer competing priorities—they are mutually reinforcing. Microsoft (MSFT) – Strong Numbers, Cautious Market Reaction Reported: January 28, 2026 (After Market Close) Microsoft once again posted solid financial results, though market reaction was mixed. Despite operational strength, investors remain sensitive to capital intensity and near-term margin dynamics. Cartwright Capital view:Microsoft remains one of the most strategically positioned AI platforms globally. Short-term margin concerns do little to undermine its long-term competitive moat. Comcast (CMCSA) – Cash Flow Strength Amid Mixed Operations Reported: January 29, 2026 (Pre-Market) Comcast delivered a mixed earnings report, highlighted by strong cash generation. Growth in wireless services and theme parks partially offset pressure in legacy segments. Cartwright Capital view:Comcast remains a cash-generating machine, but structural challenges in media and broadband competition continue to cap valuation upside. Apple (AAPL) – Earnings That Carry the Entire Market Reported: January 29, 2026 (After Market Close) Apple’s fiscal Q1 results were released after market close, making this one of the most anticipated earnings events of the season. Apple’s earnings traditionally act as a macro signal for global consumer demand. Cartwright Capital view:With expectations extremely high, Apple’s results matter not just for its shareholders, but for overall market sentiment entering Q1 2026. Key Takeaways for Investors Final Thoughts The earnings releases of January 28–29, 2026 confirm that markets are entering a phase where capital discipline, AI infrastructure, and long-term strategic positioning matter more than short-term margin fluctuations. While not all companies delivered flawless results, the broader message is clear: corporate America is betting heavily on AI—and investors must decide which balance sheets can support that bet sustainably. Disclaimer This article reflects the author’s opinions and interpretations of publicly available information. It is not investment advice. Investing in commodities and financial markets involves risk, and readers should conduct their own research or consult a licensed financial advisor before making any investment decisions.
Gold in a Relentless Bull Run: Why the Market Is Seeking Safety Again

Gold has surged above $5,500 per ounce, marking a historic repricing of the metal. This move is not a technical anomaly, nor a short-term speculative frenzy. It reflects a structural shift in how markets perceive risk, money, and systemic stability. While the magnitude of the rally is extraordinary, the underlying drivers are not new. What has changed is the urgency with which the market is now pricing them in. Real Yields Are Falling — Even at These Price Levels Gold continues to respond to its most reliable macro driver: real interest rates. Despite elevated nominal yields, inflation expectations and debt dynamics are eroding real returns across the curve. Investors are increasingly aware that holding cash or bonds no longer guarantees preservation of purchasing power. At $5,500+, gold is no longer reacting to short-term data points. It is reacting to a loss of confidence in real yield durability. The Fed Has Lost Control of Expectations Federal Reserve The Federal Reserve has not cut rates yet — but that is no longer the point. Markets have concluded that: Gold is pricing the end of credibility, not the next meeting. This Is a Systemic Trade, Not a Fear Spike The rally above $5,500 reflects deep, unresolved structural pressures: Gold is behaving less like a hedge and more like a parallel monetary anchor. Central Banks Are Still Buying — Quietly and Relentlessly One critical element has not changed: central bank demand. These buyers are not price-sensitive in the short term. Their goal is reserve diversification and long-term stability. This creates a permanent bid under the market, limiting downside and amplifying upside when financial capital joins the trade. This is why pullbacks have been shallow — and aggressively bought. Technical Structure: Vertical, but Not Broken From a technical standpoint, gold is in a momentum-driven expansion phase. This does not mean it cannot correct — it means corrections are likely to be sharp, brief, and contained. Key Price Levels (XAUUSD) Primary support zones Resistance / upside targets At these levels, gold is not cheap, but it is doing exactly what it is supposed to do. What This Means for Investors The key takeaway is simple: This is not a speculative bubble — it is a repricing of monetary reality. Short-term corrections are natural and necessary. But as long as real yields remain suppressed and debt dynamics dominate policy decisions, gold retains its strategic role. Gold above $5,500 is no longer a trade.It is a statement about trust in the system. Disclaimer This article reflects the author’s opinions and interpretations of publicly available information. It is not investment advice. Investing in commodities and financial markets involves risk, and readers should conduct their own research or consult a licensed financial advisor before making any investment decisions.
Fed Holds Rates, Tightens the Message: A Hawkish Pause That Resets Market Expectations
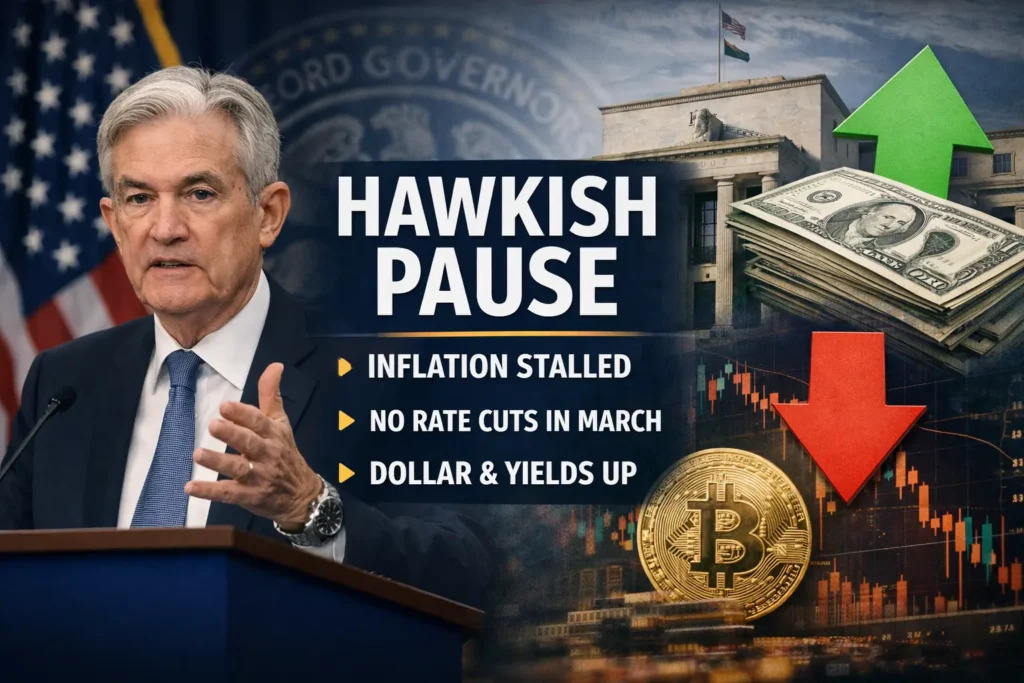
The Federal Reserve left interest rates unchanged at its latest meeting, but the substance of its communication marked a clear shift. While markets had hoped for a confirmation of imminent easing, the Fed delivered something very different: a hawkish pause. In short, rates remain high, liquidity continues to be withdrawn, and the burden of proof has shifted back to the data. Inflation Progress Has Stalled Compared to December, the official FOMC statement included several subtle but important changes. Most notably, the Fed acknowledged that progress toward the 2% inflation target has stalled over the past two months. Instead of continuing lower, inflation has moved sideways. This represents a meaningful change from the autumn narrative, when Chair Jerome Powell spoke about a “clear downward trajectory” in inflation. That confidence is now gone. At the same time, the Fed now views risks to inflation and employment as roughly balanced. Previously, recession risks were seen as dominant. This rebalancing explains why there is no urgency to cut rates. Another key point: quantitative tightening (QT) continues at the same pace. Even without rate hikes, the Fed is actively draining liquidity from the system, reinforcing restrictive financial conditions. Powell’s Press Conference: Caution and Credibility During the press conference, Jerome Powell was careful not to commit to a specific path, but several signals were clear. First, a March rate cut is highly unlikely. Powell repeatedly emphasized the need to see more data from the first quarter, effectively pushing any potential easing decision into May or June at the earliest. Second, Powell strongly defended the Fed’s independence. In response to repeated questions about political pressure, he stressed that the Fed’s mandate is set by law and that short-term political cycles must not interfere with long-term price stability. For investors, this reinforces the Fed’s institutional credibility. Third, Powell highlighted persistent inflation in the services sector. While goods prices are easing, services inflation—particularly rents, insurance, and transportation—remains sticky. This rigidity is now the primary obstacle to a sustained return to the 2% target. Market Reaction: Reality Check Markets reacted immediately to the hawkish tone. The U.S. dollar (DXY) strengthened as higher-for-longer rate expectations increased its relative attractiveness versus Europe and Japan. U.S. 10-year Treasury yields moved back toward 4.2%, reflecting the repricing of rate-cut expectations. Equities declined modestly as investors adjusted models that had assumed faster monetary easing. Bitcoin also moved lower, once again confirming its strong correlation with global liquidity conditions. What Matters Next The Fed has made it clear which data points now matter most: Until then, one message dominates: money remains expensive, liquidity is tight, and discipline matters again. Disclaimer This article reflects the author’s opinions and interpretations of publicly available information. It is not investment advice. Investing in commodities and financial markets involves risk, and readers should conduct their own research or consult a licensed financial advisor before making any investment decisions.
Netflix at the Edge of 2026: A “Media Supercycle” Bet, or a Debt-Fueled Overreach? (NFLX Deep Dive)

Entering 2026, Netflix, Inc. (NFLX) is no longer the scrappy streaming disruptor—it’s increasingly behaving like a scaled media platform with multiple monetization engines (subscription, advertising, live events, gaming) and the ability to shape industry structure. This report applies a value-investing lens: screening metrics, financial resilience, business quality (“moat”), and a valuation framework focused on intrinsic value vs. market price (including a margin-of-safety mindset). The structure follows the same disciplined approach we use when filtering “cheap-looking” stocks from genuinely healthy businesses. 1) Quant screening & current market positioning (as of late January 2026) Netflix is trading with a market cap around $393.5B, after a mild drawdown driven largely by deal uncertainty and financing concerns tied to the proposed Warner Bros. Discovery (WBD) acquisition. Valuation multiples — the context matters Netflix used to trade like a pure hyper-growth story (2015 P/E famously extreme). But by January 2026, the P/E (TTM) sits around ~33–34x, which is meaningful for two reasons: Snapshot table (your dataset): Date / Period Market Cap ($B) P/E P/B EPS (Annual) Dec 2021 267.47 53.61 16.8 1.12 Dec 2022 131.23 26.41 10.2 1.00 Dec 2023 213.10 48.55 12.4 1.20 Dec 2024 381.27 44.95 16.1 1.98 Dec 2025 428.44 39.17 15.3 2.58 (est.) Jan 2026 393.53 34.08 13.7 2.58 (actual) Takeaway: If you screen Netflix mechanically (e.g., “P/E < 15”), it fails. But screening without sector context is how investors miss compounders—so we compare within industry ranges (as our methodology explicitly recommends). Jak vybírat podhodnocené a fina… 2) Profitability & “quality score”: ROE and margin expansion One of the strongest “quality” signals here is Return on Equity (ROE), which you cited at ~41.9%. In our framework, consistently high ROE is often an indicator of strong execution and scalable economics, but it must be checked against leverage (i.e., “is ROE inflated by debt?”). Jak vybírat podhodnocené a fina… Netflix’s net margin moving to ~24.3% in 2025 (up from ~22.3%) supports the thesis that Netflix is now in a phase where operating leverage is real: revenue grows faster than operating costs, and cash conversion improves. 3) Financial statements: growth, cash flow, balance sheet Revenue growth and regional resilience 2025 revenue around $45.2B (+16% YoY), driven by member growth + pricing optimization (price increases in the U.S. plans, including ad-tier dynamics). Regional mix (Q4 2025, your dataset): Region Revenue ($M) YoY Growth FX-neutral Growth UCAN 5,339 18% 18% EMEA 3,873 18% 15% LATAM 1,418 15% 20% APAC 1,421 17% 19% Management’s 2026 outlook: ~$50.7B–$51.7B revenue (roughly 12–14% growth), broadly aligned with external estimates you referenced. Free cash flow inflection = the structural shift Netflix’s investment profile has changed. Where it once “burned cash” to build a library, it now produces multi-billion FCF annually. You referenced: This matters because FCF funds the moat: content, platform, and (when available) buybacks. Balance sheet (pre-deal) You cited total debt around $15.7B with fixed-rate unsecured notes, plus healthy interest coverage and acceptable liquidity for a subscription-heavy digital model. 4) The WBD acquisition: strategic accelerator—or a balance-sheet stress test? This is the fulcrum of the 2026 Netflix narrative: an announced deal around $82.7B (your dataset), structured as aggressively cash-heavy to win the asset and reduce equity-volatility risk. Pro-forma leverage jumps—materially Your pro-forma sketch implies net debt rising from ~$14B to ~$85B, and leverage moving toward ~3.0x. That’s not fatal for a business with strong recurring cash flows, but it does change the risk profile: Why it could deepen the moat WBD’s library is the strategic prize: HBO catalog + major IP (Harry Potter, Game of Thrones, DC, etc.). The “moat thesis” becomes: Investment reality: A deal like this can create a winner-takes-most platform—or it can create a “synergy story” that disappoints. This is where position sizing and staging (tranched buys) matter. 5) New growth engines: ads, gaming, live events Advertising: margin expansion optionality You cited a rapid scale-up in ad-tier MAUs (from ~94M to ~190M during 2025), with ad revenue reaching about $1.5B in 2025 and potentially doubling in 2026. If this holds, it changes Netflix’s earnings profile: Gaming: retention and ecosystem play Gaming remains financially small, but strategically powerful: if it increases retention and deepens engagement, it strengthens the “subscription bundle” logic. Live events (WWE, NFL windows) Live content shifts Netflix toward “always-on” cultural relevance, which can help both subscriber acquisition and premium advertising. 6) Intrinsic value: DCF scenarios + relative valuation DCF (2026–2030) — scenario framing You outlined a model using ~9% WACC and three scenarios: With the market price around $86, that’s roughly “base-case priced”—suggesting the market may be assigning low credit for WBD synergies and demanding a discount for regulatory + execution risk. PEG check You referenced PEG ~2.1 (with earnings growth ~15.7%). Not “textbook cheap,” but arguably attractive for a now-mature, high-margin platform with multiple monetization levers. 7) Risk checklist: “value trap” filters To avoid falling for a “looks-cheap-but-isn’t” story, we run the classic traps: Investment verdict Netflix entering 2026 looks less like a growth lottery ticket and more like a “quality compounder under a temporary uncertainty discount.” The core business shows strong profitability, improving cash generation, and durable platform economics. The WBD deal is the wildcard: it can either cement an unbeatable IP moat or temporarily strain the balance sheet and sentiment. Bull case (why NFLX may be undervalued) Bear case (why caution is rational) Practical strategy Disclaimer: This is educational content, not financial advice. Do your own research and consider your risk tolerance. Sources Company / filings Research / analysis / data providers Deal / industry commentary
Weekly Market Recap (January 19–23, 2026)

Geopolitics Takes the Lead as Gold Shines and Equities Turn Cautious The past week made one thing clear: financial markets in 2026 are being driven more by geopolitics than by traditional macroeconomic data. Political statements, strategic tensions, and uncertainty around global leadership have once again reshaped investor behavior across equities, commodities, and safe-haven assets. The period from January 19 to January 23, 2026 was a textbook example of this shift. 🌍 Geopolitics: The Dominant Market Force Investor attention was once again drawn to statements from U.S. President Donald Trump, whose rhetoric continues to inject uncertainty into global markets. Tariffs, Power Politics, and Market Risk Renewed threats of tariffs, protectionist messaging, and challenges to multilateral cooperation increased market anxiety—particularly in export-dependent economies and cyclical sectors. Markets quickly repriced risk as investors reassessed global trade stability. Greenland: More Than a Headline The renewed focus on Greenland may sound symbolic, but it highlights deeper strategic issues: For markets, this reinforces a key message: geopolitical stability can no longer be taken for granted. 🏦 Federal Reserve: Silence Under Scrutiny While the Federal Reserve made no new policy decisions this week, markets remained highly sensitive to discussions around: Investors increasingly view monetary policy not only as an economic tool, but also as a political variable—an important shift in market psychology. 📉 Equities: Momentum Slows, Selectivity Returns Global equity markets did not collapse—but they clearly lost momentum. United States U.S. indices traded sideways to slightly lower as investors: Technology stocks proved particularly sensitive to trade and regulatory headlines. Europe European equities underperformed due to: ➡️ The key theme: markets are no longer indiscriminate buyers. Quality, balance sheets, and cash flow are back in focus. 🪙 Gold: Safe Haven Demand Strengthens Gold was one of the clear winners of the week. Drivers behind gold’s strength: Gold continues to behave as expected in uncertain environments—not as a speculative asset, but as strategic portfolio insurance. 🛢️ Oil: Geopolitical Premium vs. Economic Reality Oil prices balanced between two opposing forces: Geopolitical Support Demand Concerns The result: a firm but volatile oil market, acting as a real-time barometer of geopolitical risk. 🧠 Key Takeaways for Investors 🔚 Conclusion This week was not defined by a single economic release, but by a shift in sentiment. Investors are being reminded that capital preservation matters as much as growth—and that resilience is becoming a defining investment theme of this cycle. Disclaimer This article reflects the author’s opinions and interpretations of publicly available information. It is not investment advice. Investing in commodities and financial markets involves risk, and readers should conduct their own research or consult a licensed financial advisor before making any investment decisions. Sources
Markets Q1 2026: AI, Data Centers, Healthcare & Media — What Investors Need to Watch

1) Semiconductors & AI — The Bullish Narrative Remains Intact The semiconductor sector continues to sit at the core of global equity market momentum, driven by relentless demand for artificial intelligence computing power. Stocks such as Intel, AMD, and Western Digital have delivered strong recent performance, reflecting sustained optimism around AI infrastructure and hardware demand. 🔍 Why this matters:AI model training, inference, and large-scale deployment are driving exponential growth in demand for high-performance chips, memory, and storage. This is no longer a short-term hype cycle — it is structural. ⚡ Energy: The Hidden Bottleneck of AI A key secondary trend is energy supply for data centers. Hyperscalers such as Amazon and Microsoft are increasingly financing and developing their own power-generation capacity — often directly adjacent to data centers — to secure long-term energy availability for AI workloads. This includes growing interest in nuclear and alternative baseload energy, highlighting an emerging investment theme at the intersection of technology and utilities. 👉 Cartwright Capital insight:Semiconductors and AI infrastructure represent a long-duration growth theme. Investors should think in terms of ecosystems — chips, energy, cooling, and data infrastructure — rather than isolated winners. 2) Healthcare & Biotech — Moderna as a High-Conviction Case Study Moderna emerged as one of the strongest performers following the release of long-term clinical data for its personalized melanoma vaccine developed in partnership with Merck and its flagship oncology drug Keytruda. 📊 Five-year data from Phase II trials indicate approximately a 49–50% reduction in the risk of recurrence or death for high-risk melanoma patients compared with Keytruda alone. 🔬 Why this is significant:This strengthens the investment thesis that mRNA technology can extend far beyond infectious disease vaccines into personalized cancer immunotherapy, opening multi-decade growth opportunities. 👉 Cartwright Capital insight:Biotech remains a high-risk, high-reward space. Companies with validated platforms and strong clinical pipelines — particularly in oncology — deserve close monitoring, but position sizing and risk discipline remain essential. 3) Streaming & Media — Strong Results, Strategic Trade-Offs Netflix continues to demonstrate operational strength: However, management has also signaled higher content spending, which introduces short-term margin pressure despite long-term competitive positioning. 🎬 M&A Spotlight: Warner Bros. Discovery Netflix has reportedly revised its proposal to acquire Warner Bros. Discovery into an all-cash transaction, aimed at reducing uncertainty for WBD shareholders and strengthening negotiating leverage. While such a deal could reshape the global media landscape, it also increases capital allocation risk and regulatory scrutiny. 👉 Cartwright Capital insight:Netflix remains a high-quality asset, but valuation and capital discipline matter. Strategic expansion beyond the core business must be assessed through the lens of long-term shareholder returns. 4) Consumer Goods & Cosmetics — Moats vs. Trends The consumer sector highlights a clear divide between established brands with strong moats and trend-driven challengers. Global leaders such as L’Oréal and Estée Lauder continue to benefit from brand loyalty, pricing power, and scale — particularly in core categories like skincare and makeup. By contrast, color cosmetics and influencer-driven brands remain highly volatile, often dependent on social media platforms such as TikTok, where trends can reverse rapidly. 👉 Cartwright Capital insight:In consumer sectors, durability of brand equity matters more than short-term growth spikes. Long-term investors should prioritize companies with proven pricing power and repeat customers. 5) Commodities & Materials — Cyclical Strength, Selective Exposure Mining and materials companies such as Rio Tinto are benefiting from solid production results and a favorable outlook for iron ore and copper, supported by electrification and infrastructure demand. That said, materials remain inherently cyclical. 👉 Cartwright Capital insight:Commodities can enhance portfolio diversification, but positions should be sized with full awareness of macroeconomic cycles and volatility. 6) Additional Stock Insights & Investor Q&A 🧠 Kraft Heinz (KHC) Berkshire Hathaway has registered its stake for a potential sale, which markets interpret as a negative signal — possibly an admission that the original investment thesis no longer holds. 🎨 Adobe (ADBE) AI-driven content creation presents both opportunity and disruption. Adobe’s valuation (around ~13x cash flow) already reflects a conservative scenario, but competitive dynamics must be monitored closely. 📚 Duolingo (DUOL) Duolingo maintains a strong competitive edge through gamification and habit formation — elements that current AI chatbots struggle to replicate at scale. 💳 Fiserv A potential turnaround story under new management, though the payments space remains highly competitive with compressed margins. 📌 Final Takeaway for Investors Constructive / Bullish Themes Areas Requiring Caution Disclaimer This article reflects the author’s opinions and interpretations of publicly available information. It is not investment advice. Investing in commodities and financial markets involves risk, and readers should conduct their own research or consult a licensed financial advisor before making any investment decisions. Sources
Gold Breaks Above $4,700: A Historic Milestone or Just the Beginning?

Gold prices have surged past $4,700 per ounce, once again confirming their role as a key asset in times of global uncertainty. This move is no random spike—it reflects a powerful mix of macroeconomic pressure, geopolitics, and structural changes in the global financial system. For investors, the signal is clear: gold is firmly back in the spotlight. What’s Driving Gold Higher? 1) Eroding confidence in fiat currenciesRising government debt (especially in the U.S.), persistent deficits, and political pressure on central banks are fueling concerns about the long-term purchasing power of fiat money. Gold benefits in such an environment—it is no one’s liability and cannot be printed. 2) Real interest rates under pressureWhile nominal rates remain relatively high, inflation continues to constrain them. Real yields on bonds are low or volatile, reducing their appeal. In this setting, gold—which pays no interest—becomes a more competitive store of value. 3) Geopolitical risk and a fragmenting worldConflicts in the Middle East, tensions between major powers, and gradual deglobalization are pushing investors toward safe havens. Gold has long been a proven refuge in such times. 4) Central banks as a key driverCentral banks—particularly in emerging markets—continue aggressive gold purchases. The rationale is clear: reserve diversification and reduced reliance on the U.S. dollar. This structural demand provides a strong long-term floor under gold prices. Is $4,700 the Ceiling? In the short term, volatility and pullbacks are natural after such a sharp rally. Profit-taking is to be expected. From a long-term perspective, however, the fundamentals remain compelling.If rate cuts materialize, global debt continues to climb, and geopolitical uncertainty persists, gold has room to stay elevated—and potentially push to new highs. How Should Investors Approach This? In line with the Cartwright Capital philosophy, a few principles apply: Conclusion The move above $4,700 is more than a technical milestone. It reflects deeper structural stresses within the global financial system and serves as a reminder of why gold has preserved value for thousands of years.The key question today is not whether gold belongs in a portfolio—but how much. Disclaimer This article reflects the author’s opinions and interpretations of publicly available information. It is not investment advice. Investing in commodities and financial markets involves risk, and readers should conduct their own research or consult a licensed financial advisor before making any investment decisions. Sources & References Institutional & Official Data Market & Financial Media Analytical & Educational Resources
Rates or Ruin? Why the U.S. Needs Lower Interest Rates – and What It Means for Investors
For years, investors have been taught to fear inflation, rising interest rates, and central bank tightening. But beneath the surface of today’s macro environment lies a far more uncomfortable truth: the United States can no longer afford high interest rates. This is not a political statement. It is a mathematical one. As U.S. public debt accelerates beyond historic norms, interest rates themselves have become a systemic risk. The question is no longer whether rates will come down — but how, when, and at what cost. 1 ) America’s Debt Problem Is No Longer About Debt U.S. federal debt has now exceeded $38 trillion, rising by more than $15 trillion in just five years. The pace of borrowing is accelerating, not slowing. However, the real danger is not the absolute size of the debt — it is the cost of servicing it. Annual U.S. interest expenses are approaching $1.5 trillion, roughly 5% of GDP, the highest level in nearly three decades. In practical terms, the government is increasingly borrowing not to invest, but simply to pay interest on past debt. This is what economists call a debt spiral. At elevated interest rates, the system feeds on itself: At a certain point, fiscal sustainability collapses under its own weight. 2) The Fed, Politics, and an Uncomfortable Reality The tension between Donald Trump and Jerome Powell reflects a deeper structural conflict. The Federal Reserve is mandated to fight inflation and maintain price stability. But the U.S. Treasury must refinance trillions of dollars of debt — much of it short-term — at prevailing market rates. In an environment of high debt, monetary independence becomes fragile. This phenomenon is often described as fiscal dominance: when central banks are indirectly pressured to accommodate government financing needs. The uncomfortable conclusion?Persistently high rates are incompatible with today’s U.S. debt structure. 3) Why Rates “Must” Come Down This does not mean rate cuts will be smooth or risk-free. Lower rates reduce the immediate burden of debt servicing, but they come at a price: History suggests governments often choose financial repression — keeping rates below inflation — as a politically palatable way to manage excessive debt. For investors, this environment is neither bullish nor bearish by default. It is unstable. The Investment Consequences: Volatility Over Certainty Markets dislike instability. And when investors begin to question the sustainability of fiscal and monetary policy, volatility becomes structural rather than cyclical. Several asset classes tend to benefit from such regimes: 1. Long-Duration Bonds Counterintuitively, falling rates support long-term government bonds — especially once rate cuts begin. However, volatility remains elevated during the transition. 2. Gold and Real Assets Gold historically performs well during periods of: This is why institutions such as World Gold Council consistently frame gold as a monetary hedge rather than a speculative asset. 3. Equities — Selectively Equities can benefit from lower discount rates, but not uniformly. Companies with: are far better positioned than highly indebted or speculative growth firms. 4) Why Diversification Is No Longer Optional In a world where: single-asset strategies become fragile. This is why frameworks such as permanent or all-weather portfolios regain relevance — not because they maximize returns, but because they minimize regret. Capital preservation becomes as important as capital growth. 5) Final Thoughts The U.S. debt problem is not theoretical. It is active, measurable, and accelerating. Interest rates will likely fall — not because inflation is conquered, but because the system demands it. For investors, the challenge is not predicting the exact timing of rate cuts, but positioning for a regime where volatility, inflation risk, and policy constraints coexist. In such an environment, discipline, diversification, and realism outperform optimism. Disclaimer This article reflects the author’s opinions and interpretations of publicly available information. It is not investment advice. Investing in commodities and financial markets involves risk, and readers should conduct their own research or consult a licensed financial advisor before making any investment decisions. Sources Sources & Further Reading U.S. Debt, Fiscal Sustainability & Interest Costs Monetary Policy, Federal Reserve & Interest Rates Inflation, Financial Repression & Currency Risk Investment Implications: Bonds, Gold & Equities Market Data & Macro Visualization Portfolio Construction & Risk Management
Weekly Market Recap: What Moved Markets From January 12 to 16, 2026
The past week delivered a powerful reminder of how sensitive global markets remain to political risk, central bank credibility, and macroeconomic uncertainty. From mounting pressure on the Federal Reserve to record-breaking moves in gold, investors were forced to reassess risk across asset classes. Here is a clear and structured overview of what mattered most. 1) Macro & Central Banks: Fed Independence in the Spotlight Pressure on the Federal Reserve Shakes Market Confidence The dominant macro theme of the week was growing political pressure on the U.S. Federal Reserve. News surrounding scrutiny of the Fed’s leadership raised concerns about the long-term independence of the central bank — a cornerstone of global financial stability. Markets reacted quickly: While the investigation itself is administrative in nature, investors interpreted the situation as a systemic risk, not a short-term headline. Interest Rate Expectations Remain Cautious Despite political noise, expectations for U.S. interest rates remained relatively stable. Markets continue to price in a “higher-for-longer” environment, with potential rate cuts pushed further into the second half of 2026 — contingent on inflation data and economic momentum. 2) Equity Markets: Volatility and Sector Rotation Major Indexes End the Week Lower U.S. equity markets struggled to find clear direction: The start of earnings season failed to provide a strong catalyst, keeping sentiment cautious. Small-Cap Stocks Outperform In contrast, small-cap stocks outperformed, with the Russell 2000 index reaching new highs. This suggests a rotation away from mega-cap technology toward: This divergence is an important signal for portfolio positioning. 3) Commodities: Gold Dominates the Narrative Gold Reaches New All-Time Highs Gold was the clear winner of the week. Driven by: gold prices surged to new record levels before experiencing a mild pullback toward the end of the week. Importantly, the correction appeared technical rather than fundamental, with prices remaining well above key support levels. Why Gold Matters Now Gold once again proved its role as: For long-term investors, this reinforces gold’s strategic — not speculative — value. 4) Global Sentiment & Economic Outlook Investor Sentiment: Cautious, Not Panicked Despite heightened uncertainty, markets did not enter a risk-off spiral. Instead, sentiment can best be described as: Inflation Risks Remain Underestimated Several macro analysts warned that inflation risks in 2026 may be underpriced, particularly if political interference weakens monetary discipline. This scenario would further support real assets and defensive positioning. 5) Key Takeaways From the Week Asset / Theme Weekly Insight Federal Reserve Political pressure raises systemic concerns U.S. Equities Modest declines, elevated volatility Small Caps New highs, strong relative performance Gold Record levels, confirms safe-haven status U.S. Dollar Weakened amid institutional uncertainty Final Thoughts for Investors The week of January 12–16 highlighted a critical theme for 2026: confidence in institutions matters. When that confidence is questioned, capital moves quickly toward safety. Gold’s performance was not accidental — it was a rational response to uncertainty. Meanwhile, equity markets are increasingly selective, rewarding balance sheet strength and penalizing excess optimism. As we move forward, investors should remain focused on: Disclaimer This article reflects the author’s opinions and interpretations of publicly available information. It is not investment advice. Investing in commodities and financial markets involves risk, and readers should conduct their own research or consult a licensed financial advisor before making any investment decisions. Sources The analysis above is based on publicly available information from reputable financial media and market data sources.
Gold Holds Below Record Highs After Strong U.S. Data — Still Set for a Weekly Gain

Gold is consolidating just below record highs near $4,600/oz. Strong U.S. labor data lifted the dollar and cooled near-term rate-cut bets. Here’s what matters next. What happened: profit-taking near records, but the uptrend remains intact Gold eased slightly into the end of the week, trading just below the fresh records set earlier in the week. Investing.com reported spot gold around $4,608/oz and futures near $4,611/oz, while still pointing to a weekly rise. Reuters also noted that despite the pullback, gold was on track for roughly a 2% weekly gain after hitting record levels midweek. In plain terms: a short-term pause, not a trend break. 1) The main headwind: strong U.S. data → stronger dollar and higher yields The chain reaction is straightforward: Reuters explicitly connected better-than-expected U.S. labor signals to a firmer dollar and reduced expectations for near-term rate cuts, weighing on gold.Reuters’ broader market wrap also tied improving risk appetite and shifting Fed expectations to USD strength—another headwind for gold. 2) Another headwind: less geopolitical fear = weaker safe-haven bid Gold has benefited from geopolitical risk in recent weeks. When tensions cool even slightly, the immediate safe-haven impulse tends to fade. Reuters mentioned that easing tension around Iran and a softer tone reduced urgent demand for havens.Investing.com similarly framed gold’s pullback as a mix of strong U.S. data and calmer geopolitics keeping prices below records. 3) Why gold is still “holding up” at elevated levels The fact that gold isn’t falling hard after such a strong run is a signal of underlying demand. Commonly cited supports include: A) The market still expects policy easing in 2026 — just not immediately Bloomberg commentary in recent days has highlighted that markets continue to weigh multiple Fed cuts across 2026, though timing shifts with each data release. B) Structural demand: investment hedging motives UBS has maintained a bullish stance in its commentary, citing ongoing demand for hedging against macro and geopolitical risks. C) A classic “post-breakout consolidation” phase FXStreet described the softer tone in gold as consistent with reduced safe-haven demand and more cautious Fed-cut pricing. 4) What to watch next week: an investor/trader checklist If you want an actionable playbook, these are the key triggers: Conclusion: records aren’t the end — they often mark the start of a new phase The picture is consistent across sources: gold is extremely elevated, but still well supported. Strong U.S. data and calmer geopolitics can suppress the safe-haven impulse in the short run. But structural forces—hedging demand and the broader path toward easier policy—keep gold anchored near highs. Bottom line: Disclaimer This article reflects the author’s opinions and interpretations of publicly available information. It is not investment advice. Investing in commodities and financial markets involves risk, and readers should conduct their own research or consult a licensed financial advisor before making any investment decisions. Sources
Why Is the Price of Gold Rising Today? Investors Are Seeking Certainty in an Uncertain World

1️⃣ Uncertainty Is Fueling Demand for Gold Gold historically performs best during periods of elevated uncertainty, and that condition is clearly present today: When confidence in the global system weakens, investors naturally reduce exposure to risk assets and seek stores of value that are independent of governments, currencies, and corporate balance sheets. Gold has played this role for centuries—and continues to do so. 2️⃣ Interest Rates and Real Yields Are a Key Driver One of the most important determinants of gold prices is the level of real interest rates (nominal rates adjusted for inflation). Crucially, gold reacts not only to actual policy moves, but to expectations. Even the anticipation of lower future rates can support higher gold prices today. 3️⃣ A Softer U.S. Dollar Supports Gold Gold is priced globally in U.S. dollars. When the dollar weakens: Current concerns about U.S. fiscal deficits, political pressure, and shifting monetary expectations are contributing to a softer dollar environment—one that is traditionally favorable for gold. 4️⃣ Central Banks Are a Structural Source of Demand One of the most underappreciated factors behind gold’s strength is central bank buying. This consistent institutional demand creates a strong fundamental floor under gold prices, making the market more resilient to short-term volatility. 5️⃣ Investor Psychology: Capital Preservation Over Yield Chasing After years dominated by a “risk-on” mindset, investor behavior is shifting. Increasingly, the key question is not: “How do I maximize returns?” but rather: “How do I protect capital?” In this context, gold: This explains why gold can rise even when inflation is not accelerating sharply—markets are pricing risk, not just price pressures. 6️⃣ What Could Reverse the Trend? To maintain balance, it is important to acknowledge potential headwinds: Absent these developments, the fundamental case for gold remains broadly constructive. Conclusion: Gold as Insurance, Not Speculation The current rise in gold prices is not driven by hype or irrational exuberance. It reflects a rational response to a world characterized by elevated uncertainty, changing monetary expectations, and long-term structural risks. Gold today is not signaling that the system is collapsing—but rather that risk is higher than it appears on the surface. For investors, this serves as a reminder that capital preservation matters as much as capital growth, especially late in the economic cycle. Disclaimer This article reflects the author’s opinions and interpretations of publicly available information. It is not investment advice. Investing in commodities and financial markets involves risk, and readers should conduct their own research or consult a licensed financial advisor before making any investment decisions. Sources
Oil Market in 2026: A Storm Before the Clearing? What Investors Need to Know

f you’ve been following the oil market, you’ve likely noticed the growing nervousness at the start of this year. Oil prices are under pressure and headlines warn of massive oversupply. Is it time to panic—or could this be a rare buying opportunity? We took a closer look at what major Wall Street players are forecasting for 2026. Consensus: A Year of Oversupply and Cheaper Oil While UBS labels 2026 a “transition year” with an average Brent price around $62 per barrel, other institutions are even more cautious. Analysts from Goldman Sachs and Morgan Stanley warn that the “darkest hour” for oil may not be over yet. The main driver is simple math: supply is growing faster than demand. Non-OPEC producers—especially the U.S., Brazil, Guyana, and Canada—are pumping record volumes, while demand growth in China has been weaker than expected, partly due to the rise of electric vehicles. Light at the End of the Tunnel? Not everything is bleak. UBS offers a key insight: 2026 may mark the cycle’s trough. The oversupply is expected to peak in Q1 2026, pressuring prices in the short term, but setting the stage for market rebalancing thereafter. Why could the trend reverse? The Wild Card: Geopolitics Geopolitical risks remain a critical factor. Any unexpected disruption in supplies from Russia, Iran, or Venezuela could quickly erase the anticipated surplus. The IEA sees an oversupplied market but also warns that OPEC+ spare capacity could shrink rapidly in the event of political shocks. What Does This Mean for Your Portfolio? For investors in 2026, three core strategies stand out: Conclusion 2026 will be a test of investor nerves. The short-term outlook is weak, but history shows that periods of peak pessimism often create the best long-term opportunities. Disclaimer This article reflects the author’s opinions and interpretations of publicly available information. It is not investment advice. Investing in commodities and financial markets involves risk, and readers should conduct their own research or consult a licensed financial advisor before making any investment decisions. Sources UBS Global Wealth Management: Outlook 2026: Transition Year for Oil Markets Goldman Sachs Research: Commodities Outlook 2026: Ride the Power Race Morgan Stanley: Oil Price Forecast Revisions (Jan 2026) IEA (International Energy Agency): Oil Market Report 2026 JP Morgan: Global Commodities Strategy Investing.com: Market Analysis & Commodities News
Why Time Is the Investor’s Greatest Ally — When Paired with Quality

In investing, most conversations revolve around strategy, stock selection, or market timing. Yet one factor consistently outweighs all others: time. Time allows capital to compound, smooths short-term volatility, and gives strong businesses the opportunity to reveal their true value. Time alone, however, is not a magic solution. In a changing economic environment, time works best when combined with quality. This article explains why. 1. Compounding: The Silent Force Behind Long-Term Wealth Compounding is the process by which returns generate additional returns. Over long periods, this effect becomes exponential rather than linear. An investment that compounds steadily doesn’t just grow — it accelerates. Early results may look modest, but over decades, compounding becomes the dominant driver of total returns. This is why long-term investing has historically rewarded patience far more than activity. Time is what allows compounding to do the heavy lifting. 2. Starting Early Matters More Than Starting Big One of the most underestimated truths in investing is that starting early beats starting large. Small, consistent investments made over long periods often outperform larger sums invested later. The reason is simple: time extends the compounding runway. Each additional year increases the portion of returns generated by past gains rather than new contributions. Waiting for the “perfect moment” often costs more than investing imperfectly but early. 3. Markets Are Volatile Short-Term — But Tend to Grow Long-Term Short-term market movements are driven by sentiment, headlines, and uncertainty. Long-term outcomes, however, are driven by earnings, cash flows, and economic growth. Despite wars, recessions, inflation shocks, and policy mistakes, equity markets have historically trended upward over long horizons. Investors who stayed invested — rather than reacting emotionally — were consistently rewarded. Time in the market has proven more powerful than timing the market. 4. Discipline and Consistency Still Matter — But Selection Will Matter More Regular investing and disciplined capital allocation remain essential. Systematic investing helps reduce emotional decision-making and spreads risk over time. That said, it is important to acknowledge a structural shift: What worked broadly in the past may not work as effortlessly in the future. In an environment shaped by: the gap between strong businesses and weak ones is likely to widen. This does not mean broad exposure will stop working. It does mean that: future returns may depend more heavily on owning resilient, financially sound companies rather than simply owning “the market.” Discipline remains crucial — but discipline combined with thoughtful selection may define long-term success going forward. 5. Time Turns Small Capital Into Meaningful Wealth One of the most counterintuitive aspects of investing is that the majority of total returns often occur in the later years of the investment journey. In the early phase, contributions dominate results. Later, compounding takes over. This is why abandoning a long-term strategy too early can be costly — the most powerful phase often comes last. Investing is not about speed.It is about endurance. 6. Time Beats Perfection Many investors spend years waiting for the ideal entry point. History suggests that being invested matters more than being perfect. Markets reward participation, patience, and the ability to remain invested during uncertainty. Time absorbs mistakes. Quality reduces risk. Together, they form a powerful combination. Conclusion: Time Is Powerful — Quality Makes It Durable Time remains one of the most powerful forces in investing. It enables compounding, reduces the impact of volatility, and gives strong businesses room to grow. But the investment landscape is evolving. Higher uncertainty and structural change suggest that time alone may no longer be enough. The most resilient long-term strategies are likely to combine: Time is still on the investor’s side.It simply works best when built on solid foundations. Disclaimer: This article is for informational and educational purposes only and reflects personal analysis and opinions. It does not constitute financial, investment, or trading advice. Always do your own research and consider your individual circumstances before making any investment decisions.
Financial Markets 2026 – Geopolitics, Trump, and Outlook
1. 2025 Recap: Unexpectedly Strong Growth 2025 was a wild year for investors, but ultimately very profitable. Despite a challenging geopolitical environment, the markets demonstrated immense resilience. Market Performance: The US S&P 500 index finished the year near its highs with a gain of approximately 16%, outperforming the long-term average (10.8%). Trump’s Tariff Policy: Markets had to contend with Donald Trump’s aggressive tariff policy, as he adjusted tariff schedules against the entire world. In April 2025, this even triggered a short-term slump (a so-called “Swift Bear Market”), but indices recovered quickly once Trump shifted to a more consensual rhetoric. Economic Growth: Despite high rates and debt, the US economy grew by 1.8–2%, dispelling fears of a recession. 2. Geopolitics in 2026: Spheres of Influence and the Law of the Strongest The main theme for 2026 isn’t pure economics, but rather aggressive US geopolitics. New US Doctrine: America is resigning from “soft power” and international institutions (UN). Instead, it is carving out spheres of influence where it applies the law of the strongest. This is a message to both China and Russia. Intervention in Venezuela: A major event at the start of 2026 is the US military intervention in Venezuela against Maduro. The goal is to install a pro-American government, restore oil production (companies like Chevron, Exxon), and drive global oil prices down. Message to China and Russia: The swift operation in Venezuela is intended to show China (in the context of Taiwan) and Russia the efficiency of the US military, in contrast to the protracted war in Ukraine. 3. War in Ukraine: No Peace in Sight Initial expectations that Trump would quickly end the war proved to be unfounded. Russian Ambitions: Russia does not want to give up territory, and its goal remains the curtailment of Ukraine or the creation of a puppet state. Ukrainian Position: Zelensky refuses peace at any cost. The main sticking points are: The Zaporizhzhia Nuclear Power Plant, Donbas, and security guarantees (Russia refuses the presence of Western troops in Ukraine). Investment Impact: The European defense sector, which underwent a correction in hopes of peace, may become attractive again as the conflict is set to continue. 4. Macroeconomic Outlook: Inflation vs. Deflation The US economy is experiencing an interesting dichotomy between sectors and conflicting inflationary pressures. Manufacturing vs. Services: The manufacturing sector (in the US, China, and Germany) is in contraction. The economy is being driven by services. Czech industry only emerged from a long recession at the end of 2025. Labor Market: Cooling is occurring. Unemployment in the US rose to 4.5%, which is still a historically low and healthy figure that helps dampen wage inflation. Clash of Inflationary Influences: Pro-inflationary: Trump’s tariffs and protectionism make goods more expensive. Anti-inflationary: Oil prices. Due to pressure on production (Venezuela) and weaker demand from China, oil could fall by another 10–15%. This acts as a positive supply shock. 5. The Fed and Interest Rates The Fed is cutting rates, perhaps faster than is healthy, under pressure from the White House. Politicization of the Fed: Donald Trump is unhappy with Jerome Powell and is looking for someone to lead the Fed who will be “accommodating” to his policy of low rates and a weaker dollar. The Dollar: Weakening due to massive US deficits and expectations of lower rates. 6. Risks for Investors (What to Watch) Although the baseline scenario for 2026 is positive (continued growth), specific risks exist: Rare Earth Elements: China controls 90% of rare earth processing. Reports are emerging that China is restricting supplies to the US, which is a weak point for American industry. Return of Inflation: If tariffs outweigh the effect of cheap oil, inflation could begin to “spike,” forcing markets into a correction. Conclusion for the Article The blog post should strike a cautiously optimistic tone: “We enter 2026 with a growth outlook, but with a finger on the trigger due to geopolitics.” Markets have become accustomed to Trump’s style of “threat – negotiation – deal,” but real risks lurk in supply chains (China) and on battlefields where America has decided to act with force. Disclaimer: This article is for informational and educational purposes only and reflects personal analysis and opinions. It does not constitute financial, investment, or trading advice. Always do your own research and consider your individual circumstances before making any investment decisions.
The Trade Desk (TTD): A High-Quality Ad-Tech Business After a Major Valuation Reset
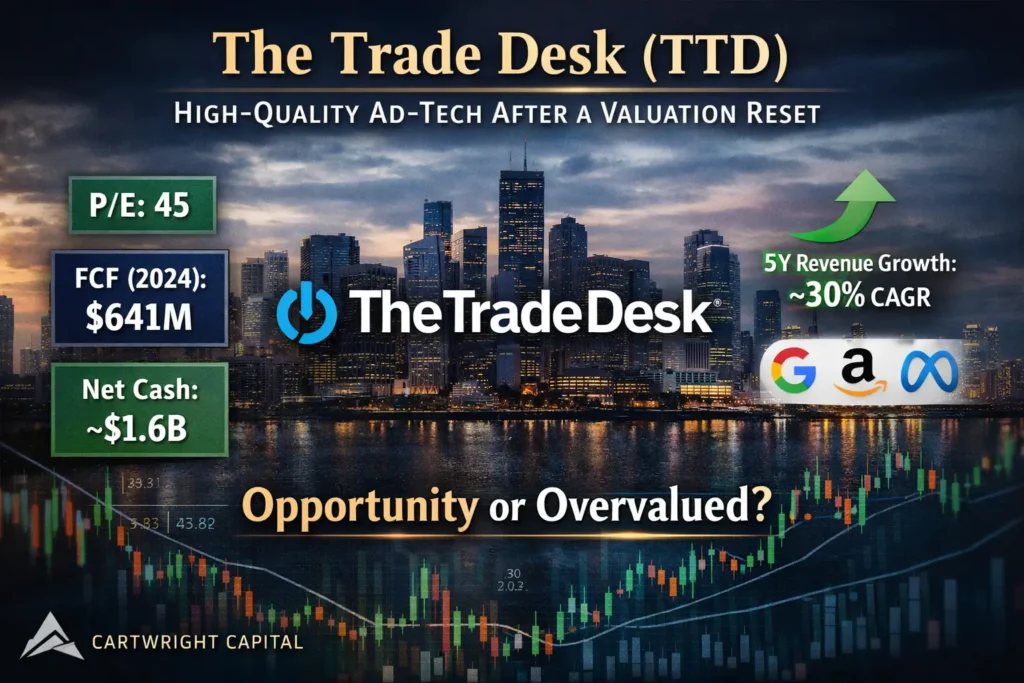
The Trade Desk is one of the strongest independent players in digital advertising, with a profitable business model, strong cash flow, and minimal debt. After a sharp valuation reset in 2025, the key question is whether TTD now offers an attractive long-term entry point—or if the stock still embeds too much optimism. The Trade Desk (TTD) is one of the most important independent players in digital advertising. It operates a leading demand-side platform (DSP) that helps advertisers and agencies buy ads programmatically across the open internet—including Connected TV (CTV), display, mobile, and audio. After a major valuation reset in 2025, TTD is no longer priced like a “perfect” growth stock. The key question is simple: Is TTD now a compelling long-term opportunity—or still too expensive given its risks? This post summarizes the core fundamentals, financial strength, valuation, and the biggest risks. The full long-form analysis is available in the linked document. Fundamental Snapshot of The Trade Desk (TTD) 1) Quantitative Screening Metrics Valuation Profitability & returns Balance sheet / liquidity Growth (historical) Dividend What it means:TTD is not “cheap” on classic value metrics, but the balance sheet is exceptionally strong, and the company remains highly profitable with strong historical growth. 2) Financial Performance and Stability Revenue growth Net income Free Cash Flow (FCF) What it means:TTD is not just a “story stock.” It produces real and growing cash flow, while maintaining strong margins. 3) Qualitative Factors Business modelTTD’s DSP enables advertisers to buy ad inventory across the open internet, typically collecting a platform fee tied to ad spend. Its strength is independence—many clients want transparency and control outside closed ecosystems. Competitive advantageTTD’s edge is built around: Industry backdropDigital advertising is large and still growing. The CTV shift (traditional TV budgets moving to streaming) is a major long-term tailwind. Management & governance What it means:TTD is widely viewed as a high-quality, founder-led compounder—but the voting structure concentrates control. 4) Intrinsic Value Lens (High-Level) TTD’s intrinsic value is highly sensitive to future growth assumptions. What it means:This looks less like a deep value bargain and more like “high quality at a more reasonable price” after the reset. 5) Risks (What Could Go Wrong) What it means:TTD’s risk is not balance-sheet fragility—it’s expectations and market re-rating. 6) Conclusion The Trade Desk appears to be a financially robust company with: However, TTD is not a classic low-multiple value stock. The investment case depends on whether you believe TTD can sustain high-quality growth long enough to justify premium multiples—especially after the 2025 reset made valuation far less extreme than in prior years. Sources Disclaimer: This article is for informational and educational purposes only and reflects personal analysis and opinions. It does not constitute financial, investment, or trading advice. Always do your own research and consider your individual circumstances before making any investment decisions.
Ares Capital (ARCC): A 9% Dividend Stock — Value Opportunity or Hidden Risk?

Ares Capital Corporation (ARCC) is often highlighted for its attractive dividend yield of around 9%. On the surface, the numbers look compelling — low valuation, strong cash flow, and a leading position in private credit. But high yield rarely comes without risk. This article breaks down ARCC’s fundamentals, balance sheet strength, dividend sustainability, and long-term risks. The goal is not to recommend an investment, but to provide a clear, structured analysis so readers can form their own view. Fundamental Analysis of Ares Capital Corporation (ARCC) 1. Quantitative Screening Metrics 2. Financial Performance and Stability Revenue and Earnings Trend (5–6 years):ARCC’s financial results reflect the cyclical nature of credit markets. In 2019, revenue was approximately $0.85 billion and net income $0.80 billion. During the pandemic in 2020, revenue fell to $0.58 billion and net income to $0.50 billion. A sharp rebound followed in 2021, with revenue reaching $1.74 billion and net income $1.59 billion. In 2022, results declined again (revenue $0.79 billion, net income $0.65 billion) due to higher interest rates and valuation adjustments. Strong recovery occurred in 2023, with revenue of $1.63 billion and net income of $1.54 billion. Results in 2024 remained stable, with revenue around $1.69 billion and net income near $1.58 billion. Over the full period, earnings more than doubled, despite interim volatility. Margins:ARCC operates with very high margins: Balance Sheet Strength: 3. Qualitative Factors Business Model & Competitive Advantage:ARCC is the largest publicly traded Business Development Company (BDC) in the U.S., focused on lending to middle-market companies. Approximately 61% of its portfolio consists of first-lien senior secured loans. Its key competitive advantages include: Industry Outlook:Private credit markets continue to grow as mid-sized firms rely less on traditional banks. This structural trend supports long-term demand for ARCC’s services. However, the industry is cyclical and sensitive to economic downturns. Management Quality:Externally managed by Ares Management, ARCC benefits from experienced leadership and disciplined capital allocation. The company has maintained or increased its base dividend for 16 consecutive years, including through crises such as 2020. Management has demonstrated prudence by maintaining conservative leverage and building earnings reserves. Market Position:ARCC is a clear sector leader, with significantly larger assets under management than most peers. Its size enables participation in larger deals and provides resilience through diversification. 4. Intrinsic Value Estimate Dividend Discount Model (DDM):Assuming a stable dividend of $1.92 growing at 2–3%: This suggests fair value in the $21–27 range, with a midpoint around $24. Multiple-Based Valuation: Margin of Safety:Current pricing offers a 10–20% margin of safety, complemented by a high recurring dividend yield. 5. Risks and Potential Value Traps Despite these risks, no major red flags (liquidity issues, dividend overpayment, structural NAV erosion) are evident. 6. Conclusion Ares Capital Corporation represents a financially sound, income-oriented value investment. The company combines: While ARCC is not deeply undervalued, it appears modestly undervalued with an attractive risk-adjusted return profile. For long-term value investors seeking income and capital preservation rather than aggressive growth, ARCC fits well within a disciplined value investing framework. Sources Disclaimer: This article is for informational and educational purposes only and reflects personal analysis and opinions. It does not constitute financial, investment, or trading advice. Always do your own research and consider your individual circumstances before making any investment decisions.
My 2025 eToro Portfolio Recap

2025 was a year where the market rewarded discipline, but it also punished overconfidence. For my eToro portfolio, I’m sharing results in relative terms — not absolute amounts — because what matters most to me is whether the process scales and stays repeatable across different market conditions. The headline numbers (relative terms) This mix also tells you something important: my year wasn’t purely “buy and hold for years.” With nearly 600 trades, some positions were held for shorter periods, and a portion of the activity was tactical — trimming, re-entries, rotations, and opportunistic setups. So instead of labeling 2025 as “long-term investing” in a strict sense of holding duration, I’d describe it like this: Long-term mindset. Tactical execution. That means the goal stays long-term (capital growth and preservation), while the implementation adapts based on price action, fundamentals, and risk. 2025 market context: the tariff-driven fear window One of the most useful moments of the year came early. In February, markets were hit with renewed trade-policy uncertainty when President Trump announced new tariffs — including a 25% tariff on steel and aluminum imports — adding fuel to broader trade-war concerns.Around the same period, U.S. stocks saw sharp down days as investors digested tariff threats alongside weaker macro signals. I’m not bringing this up to debate politics. I’m bringing it up because these headline shocks often do one thing extremely well: They create emotionally-driven pricing. When people are reacting fast, risk gets mispriced. Good assets can be sold down with bad ones. And if you’re prepared (watchlist ready, sizing rules clear, patience intact), those moments can become your best entries. This is where my “golden rule” comes in — and it’s not mine, it’s a classic: In Berkshire Hathaway’s 1986 letter, Warren Buffett wrote that they try to be “fearful when others are greedy” and “greedy only when others are fearful.” That quote is popular for a reason: it’s a simple sentence that describes how you avoid becoming liquidity for other people’s panic. So during that February fear window, my approach was straightforward: What actually worked for me in 2025 1) Process > predictionsI don’t need to predict the next macro headline. I need a portfolio that can survive uncertainty. That means diversification, position sizing, and not letting one thesis dominate my account. 2) A core mindset with a satellite executionSome holdings are “core” (built for durability). Others are “satellite” (tactical and time-bound). The key is being honest about which is which — because you manage risk differently. 3) Avoiding value trapsA stock can look cheap and still be dangerous: structural decline, weak balance sheet, shrinking margins, or unsustainable dividends can turn “value” into a trap. My filter in 2025 leaned toward durability: fundamentals, cash-flow reality, and avoiding stories that only work if everything goes perfectly. 4) Staying emotionally neutralThis is the hardest one. When volatility spikes, your brain wants action. But in investing, action is only valuable if it’s aligned with rules. “Do nothing” is often the correct move until the setup is clear. What I’m taking into 2026 I’m not trying to be a hero. I’m trying to be consistent. Not financial advice. Just sharing my recap and how I think about markets — so the next time fear hits, I’m ready to act calmly instead of reacting emotionally.
